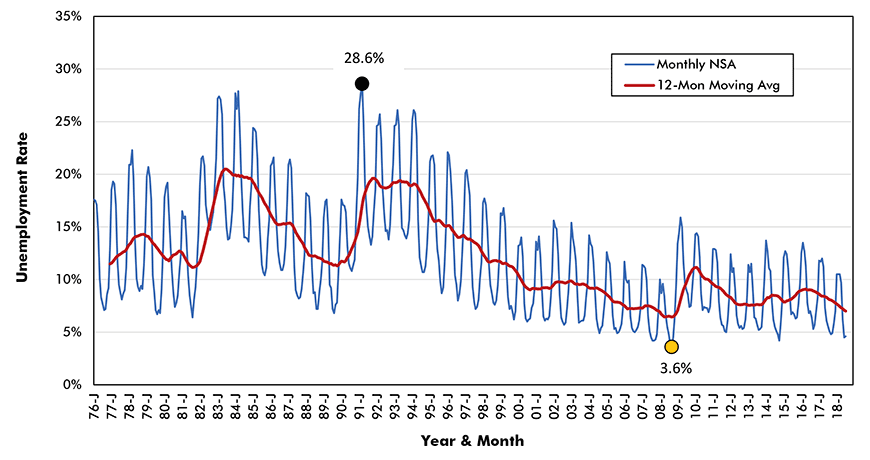
How tight have construction labour markets become in Canada? Accompanying Graphs 1 through 5 show the monthly history of construction unemployment rates from 1976 to the present for Canada and the provinces of Quebec, Ontario, Alberta and B.C. (moving from east to west across the country).
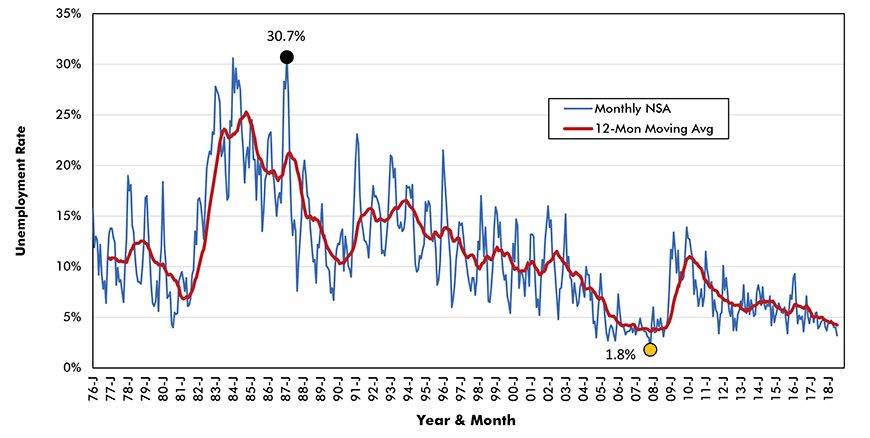
The only numbers available from Statistics Canada are not seasonally adjusted (NSA) and that’s why the one curve in each graph has such wide swings each year. The on-site jobless rate drops down in the summer when the weather is less tempestuous but shoots skyward in winter when blizzards blot the landscape.
To show trend patterns, a second curve has been added to each graph recording 12-month moving averages that are placed in the latest month (i.e., the end month of each 12-month calculation).
The highest and lowest monthly NSA construction unemployment rates are specially marked in each of the five graphs. It’s interesting to note that in all cases, the worst unemployment rates did not occur during what has come to be known as 2008-09’s Great Recession.
Instead, the darkest days for construction unemployment occurred earlier:
- Total Canada, March 1991, a 28.6% rate;
- Quebec, March 1991, 33.1%;
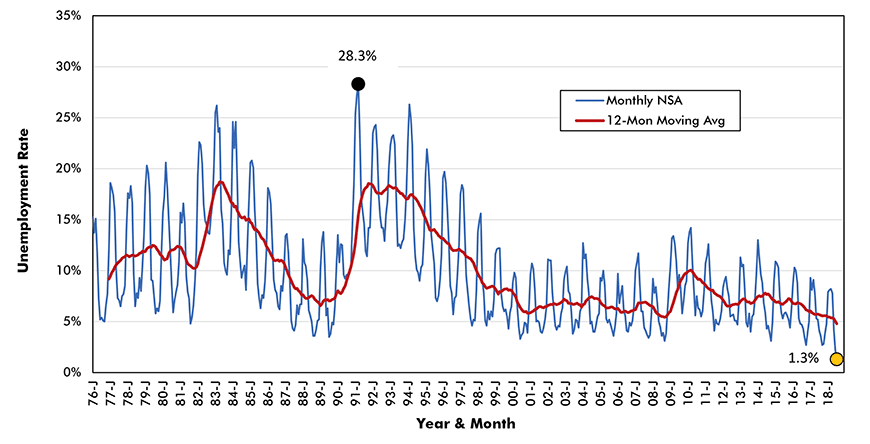
- Ontario, March 1991, 28.3%;
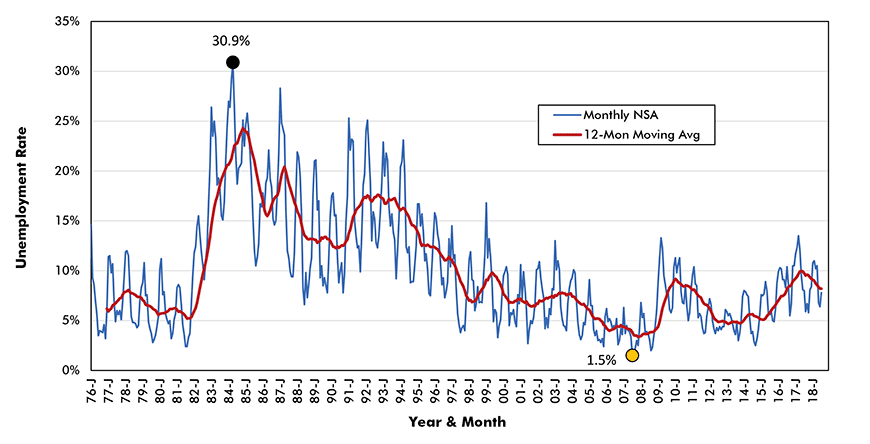
- Alberta, April 1984, 30.9%;
- B.C., February 1987, 30.7%.
I’d be remiss if I didn’t mention that the worst months are all squeezed into the three months from February to April.
What’s more fun to point out, however, is how close current construction unemployment rates are to their all-time minimal levels.
Total Canada achieved its historically low unemployment rate in September 2008, at 3.6%. July 2018’s level is only off that ‘best figure’ by one percentage point, at 4.6%.
Graph 1: Canada Construction Unemployment Rate, Not Seasonally Adjusted (NSA)
Data source: Statistics Canada (Table 14-10-0022-01).
Chart: ConstructConnect.
As recently as June of this year, Quebec matched its previous lowest construction unemployment rate of 3.7% reached in September 2008. In July 2018, the number retreated a bit, to 4.7%.
Graph 2: Quebec Construction Unemployment Rate, Not Seasonally Adjusted (NSA)

Data source: Statistics Canada (Table 14-10-0022-01).
Chart: ConstructConnect.
Ontario shines brightest of all. It’s current (July 2018) construction unemployment rate is the lowest in the entire history of the series, 1.3%. Anyone wishing to don a hard hat in Ontario can find a willing employer.
Graph 3: Ontario Construction Unemployment Rate, Not Seasonally Adjusted (NSA)
Data source: Statistics Canada (Table 14-10-0022-01).
Chart: ConstructConnect.
Alberta isn’t doing quite as well. It’s trough construction unemployment rate occurred in July 2007, at only 1.5%. The province’s present 7.8% level is considerably less noteworthy.
Graph 4: Alberta Construction Unemployment Rate, Not Seasonally Adjusted (NSA)
Data source: Statistics Canada (Table 14-10-0022-01).
Chart: ConstructConnect.
In B.C., however, construction’s labour market strength re-appears. The construction sector’s July 2018 unemployment rate of 3.2% is not far off November 2007’s deep-diving 1.8%.
Graph 5: B.C. Construction Unemployment Rate, Not Seasonally Adjusted (NSA)
Data source: Statistics Canada (Table 14-10-0022-01).
Chart: ConstructConnect.
I’m blessed with the task of scouring both U.S. and Canadian data sources. At times, U.S. material is more abundant and easier to access. But then often the reverse is true.
With respect to regional construction unemployment rates, Canada has the clear advantage – even though it would be preferable to have seasonally adjusted (SA) rather than NSA data.
For American states, unfortunately, there simply are no monthly construction unemployment rate statistics available. That’s a major shortcoming.


Recent Comments