In the U.S., there are currently 12 significant construction-related inputs or components that are recording double-digit-percentage year-over-year price increases, according to the Bureau of Labor Statistics (BLS)’s Producer Price Index (PPI) calculations.
Six of the 12 are not only showing outsized price gains. Additionally, their current levels are tied with or are exceeding previous highs since 2000. The materials in the other half dozen are experiencing current levels that are still below previous pinnacles.
Included in the first grouping are: softwood lumber (+19.5% y/y); plywood (+22.5%); particle board and OSB (+15.5%); steel pipe and tube (+16.6%); prefabricated metal buildings (+12.8%); and aluminum mill shapes (+17.8%).
Appearing in the second grouping are: asphalt (+44.9% y/y); iron and steel scrap (+25.2%); steel bars, plates and structural shapes (+18.1%); copper wire and cable (+12.8%); regular unleaded gasoline (+40.7%); and diesel fuel (+43.6%).
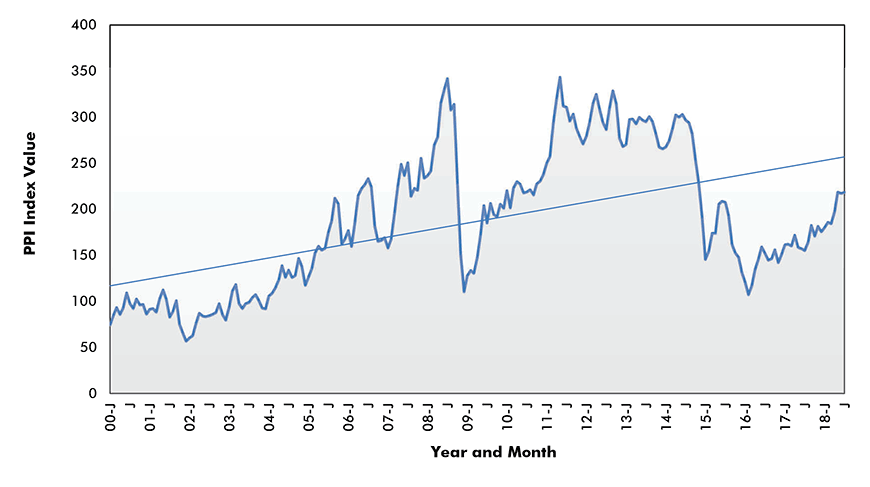
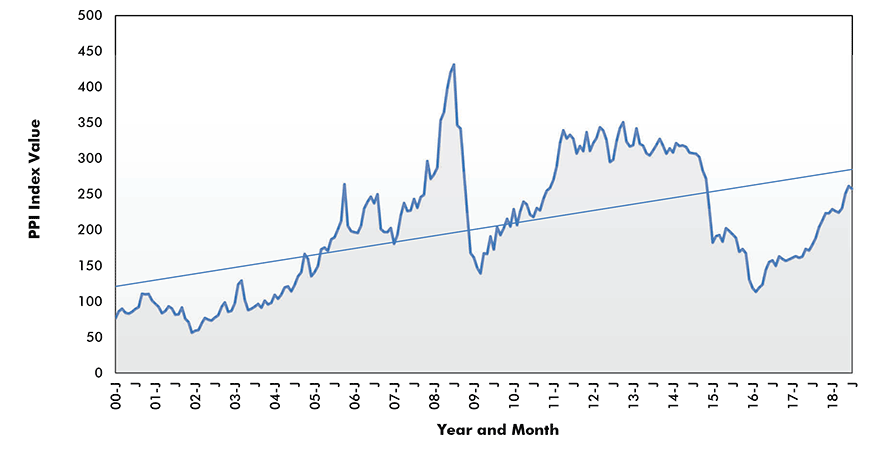
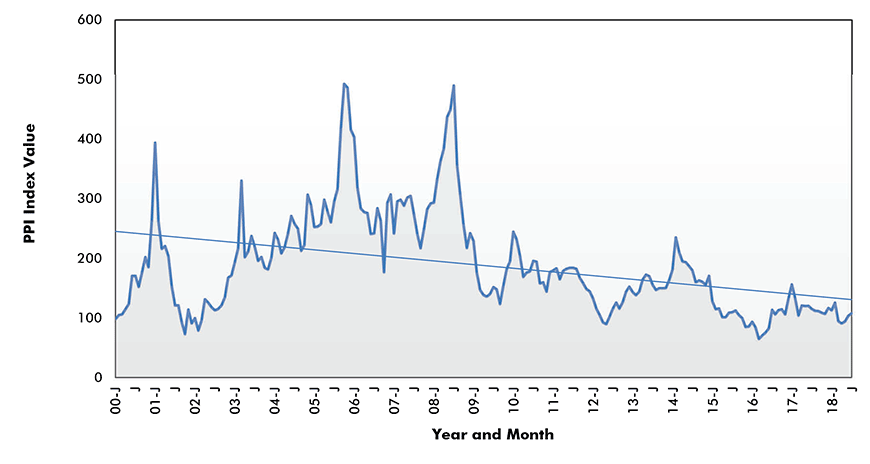
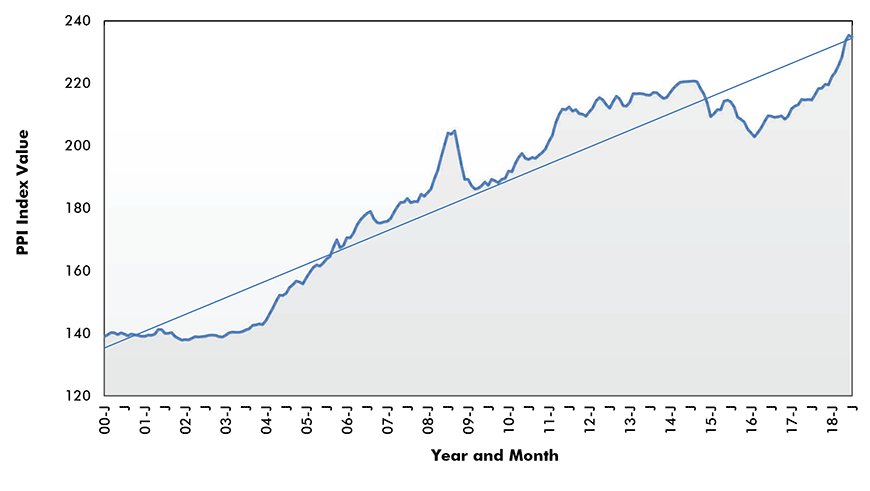
Accompanying this article are graphs showing the history, January 2000 to the present, for 38 key construction inputs, base materials or components. Below each graph is a short commentary on its appearance. (The graphs also include an Excel-generated trend line.)
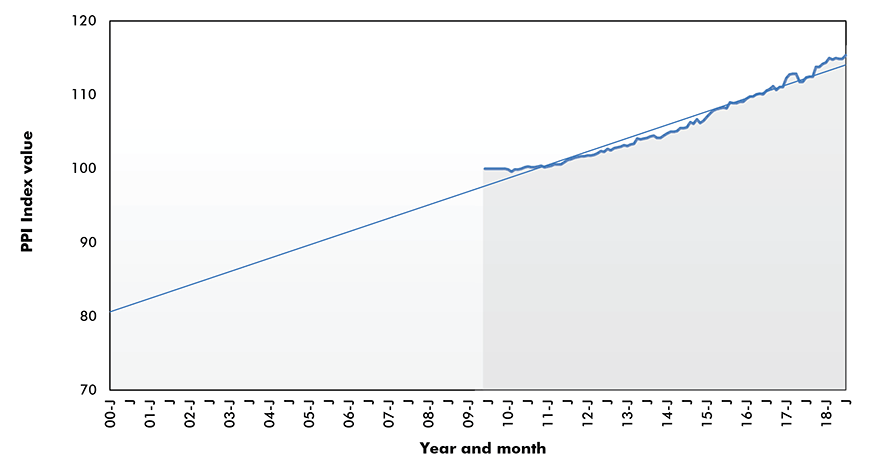
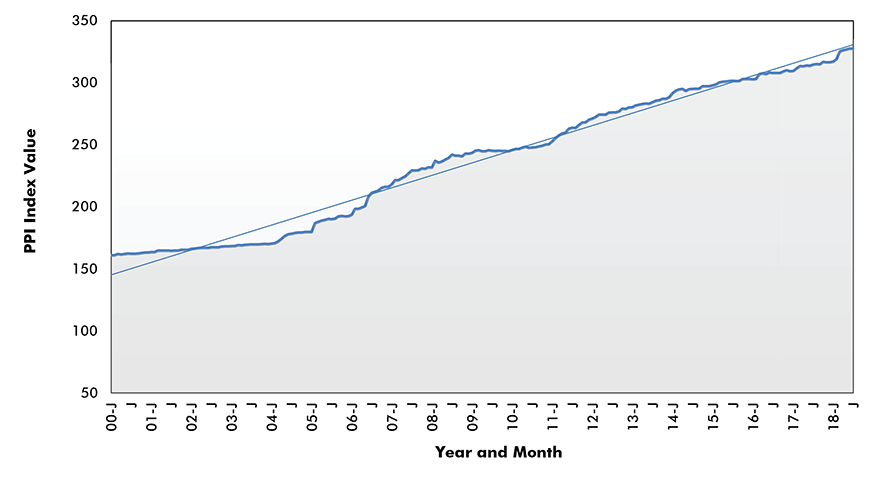
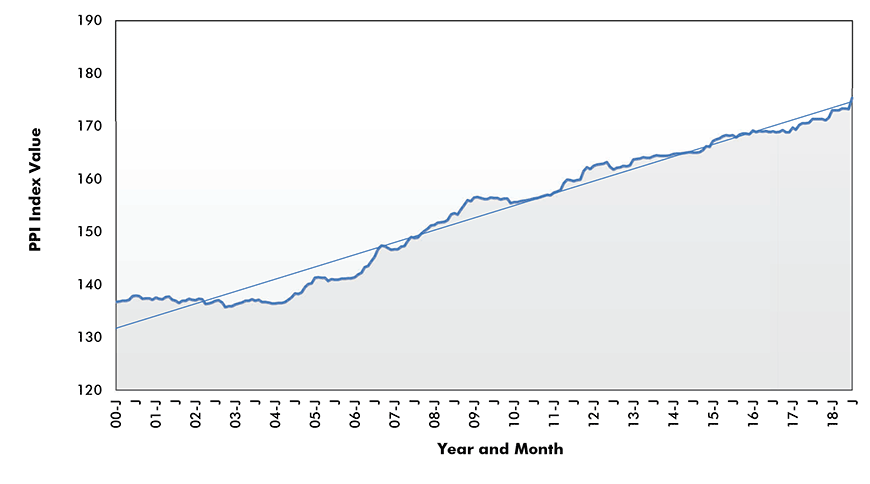
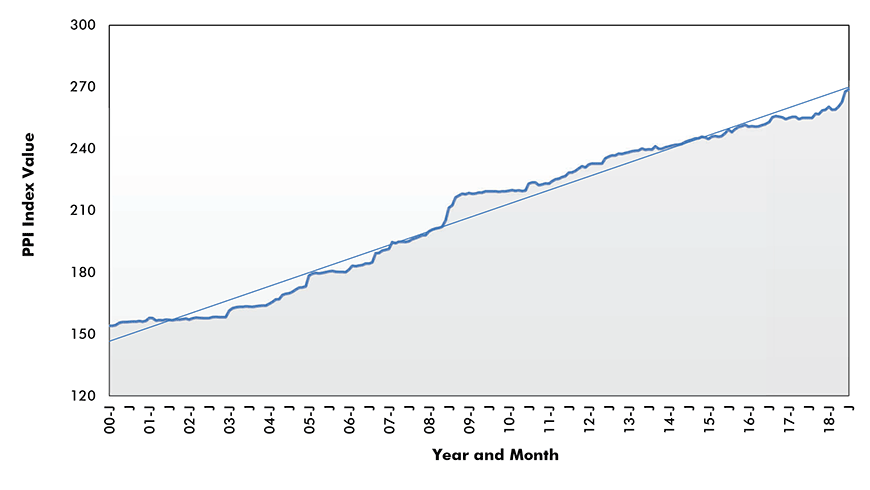
Graph 1, Architectural and Engineering Services:
The price displays minimal volatility and the curve shows a gradual steady upwards progression.
The compounding annual rate of increase over the past nine years has been +1.6%.
Graph 1: Architectural and Engineering Services Price Index – U.S. PPI
The last data point is July 2018.
Data source: U.S. Bureau of Labor Statistics (BLS), Producer Price Index (PPI) series, not seasonally adjusted (NSA) / Chart: ConstructConnect.
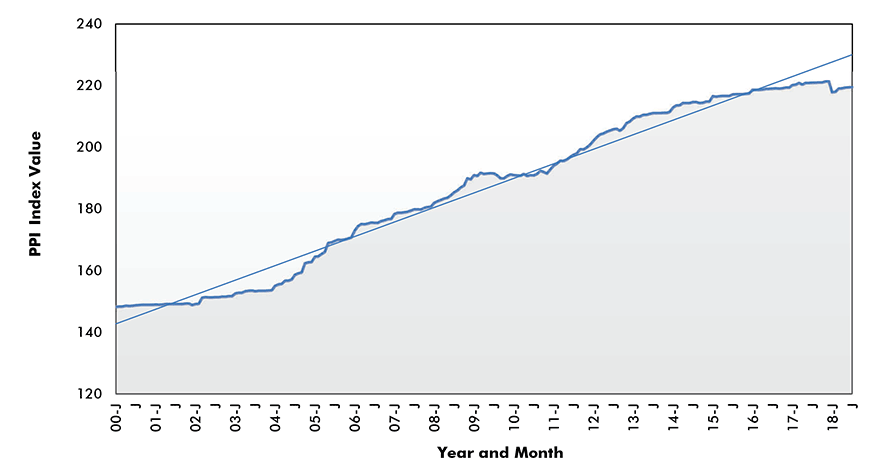
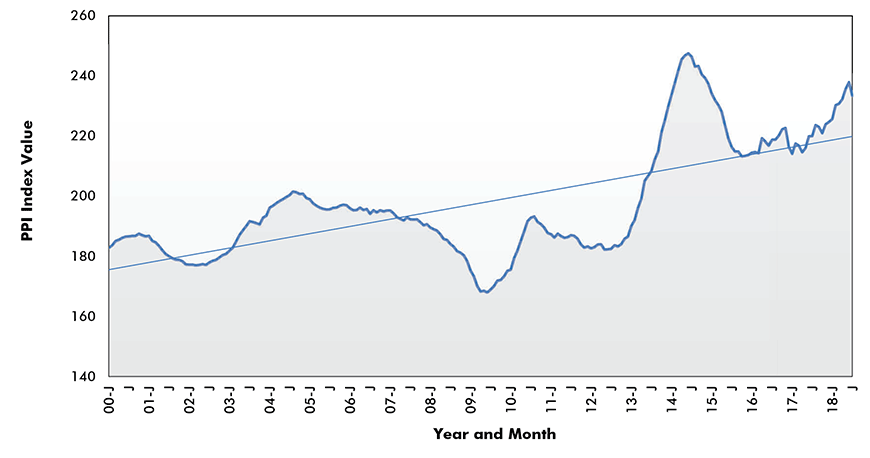
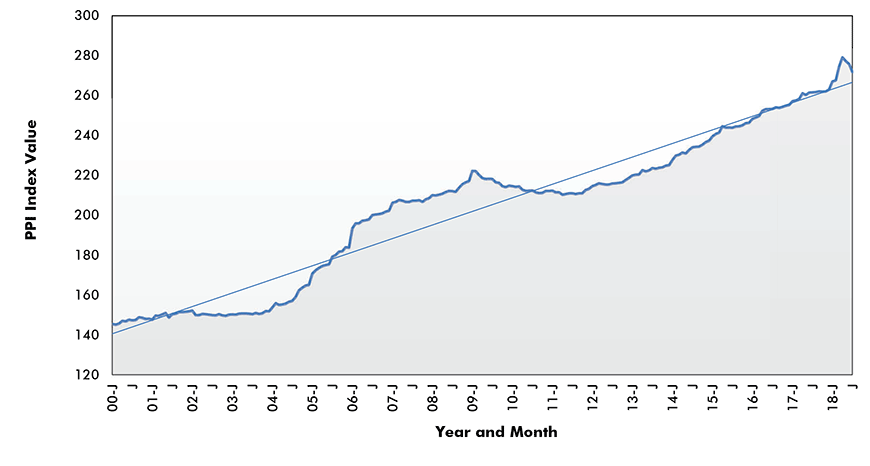
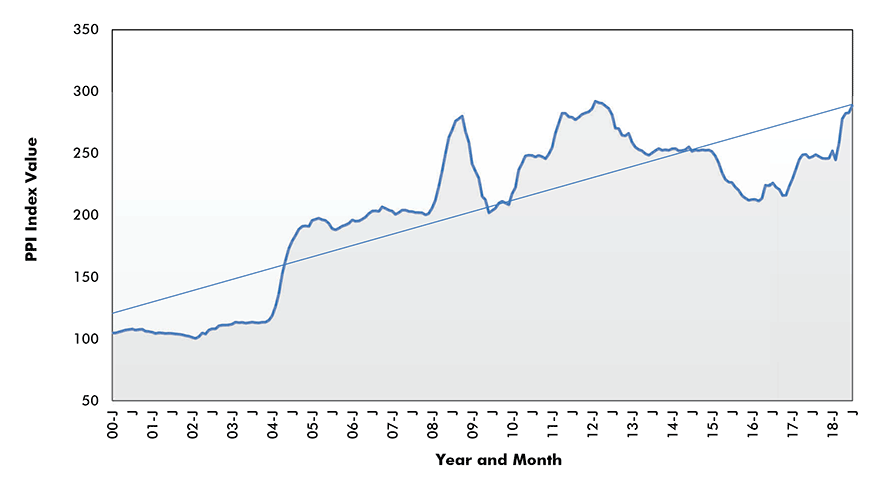
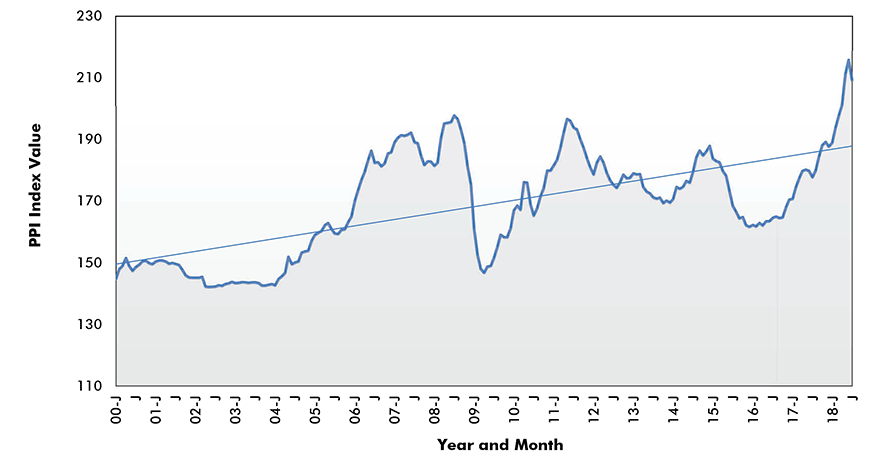
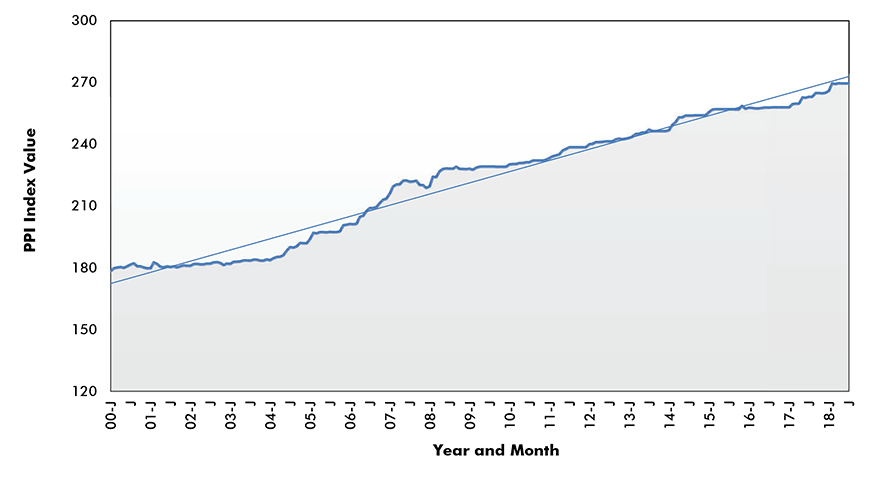
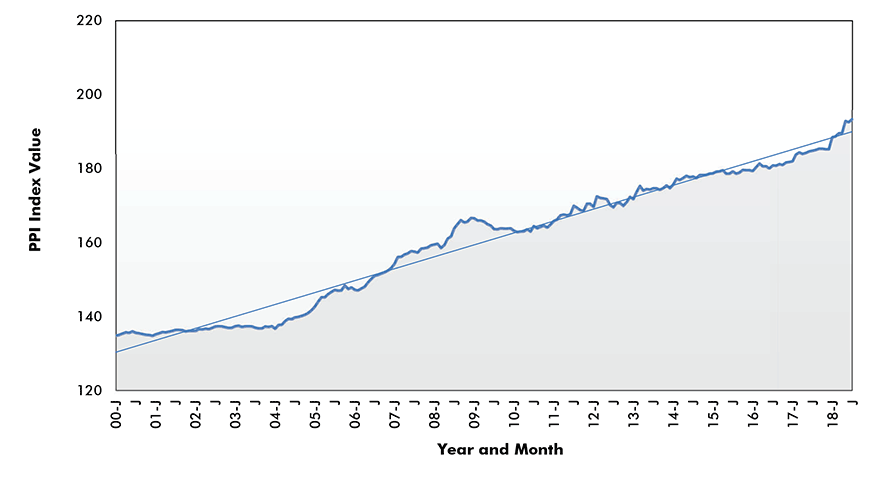
Graph 2, Construction Machinery and Equipment:
The price displays limited volatility and the curve shows a gradual steady progression upwards.
The compounding annual rate of increase over the past 18 years has been +2.1%.
Graph 2: Construction Machinery and Equipment Price Index – U.S. PPI
The last data point is July 2018.
Data source: U.S. Bureau of Labor Statistics (BLS), Producer Price Index (PPI) series, not seasonally adjusted (NSA) / Chart: ConstructConnect.
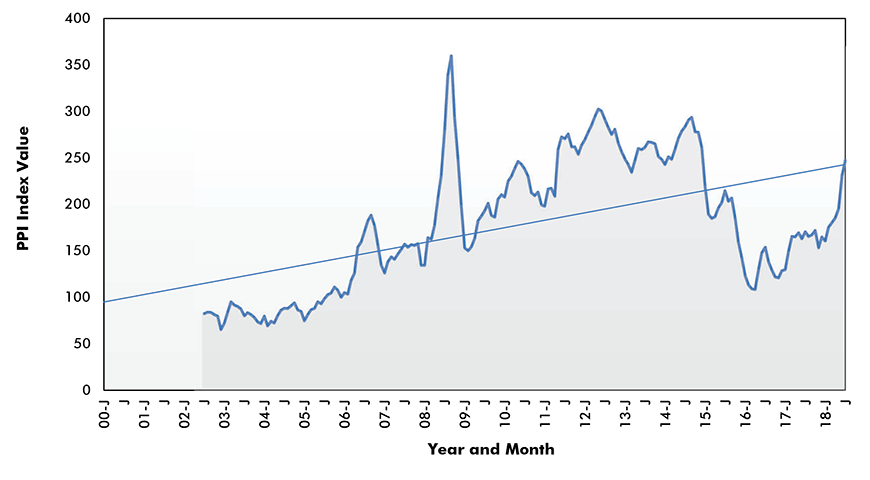
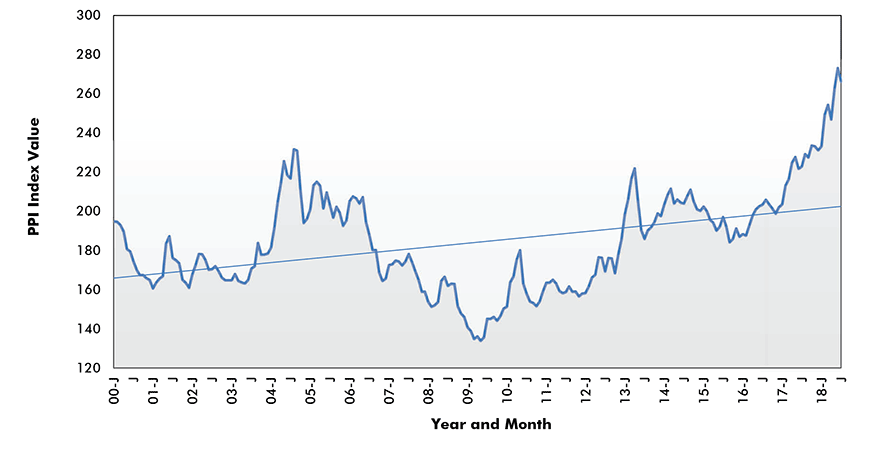
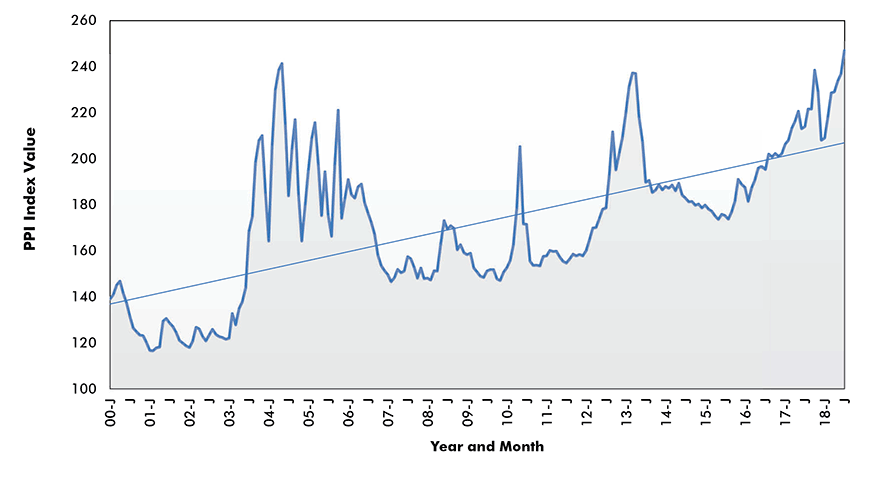
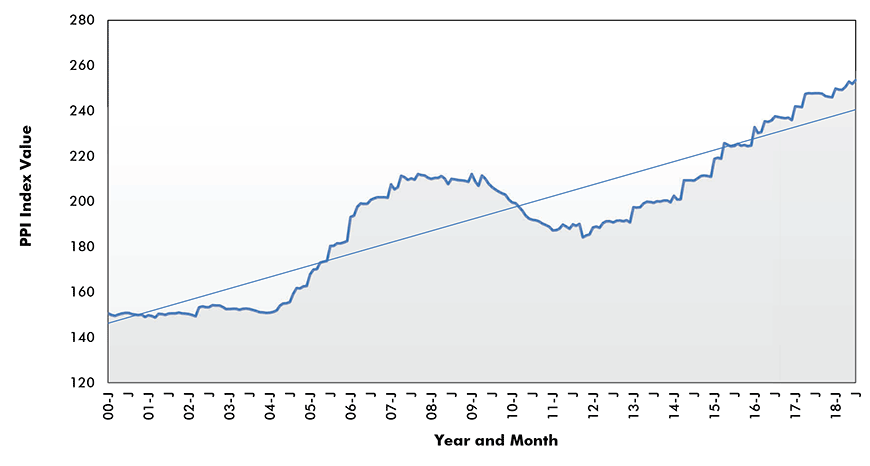
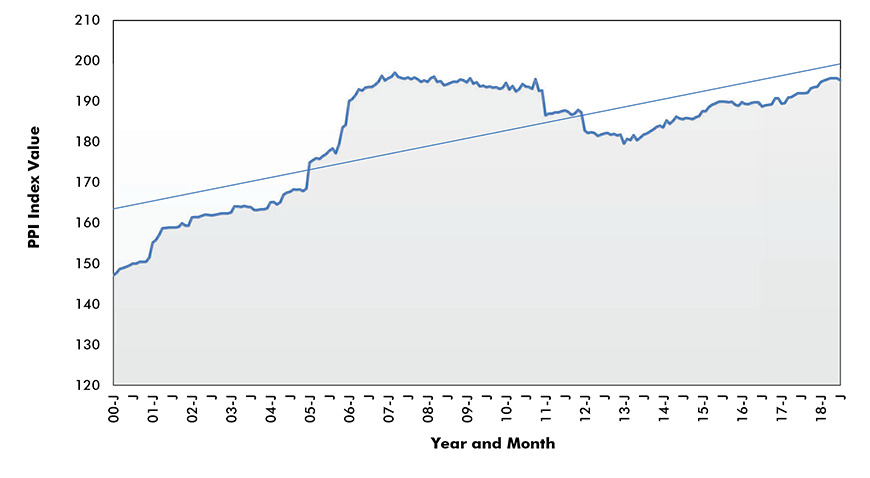
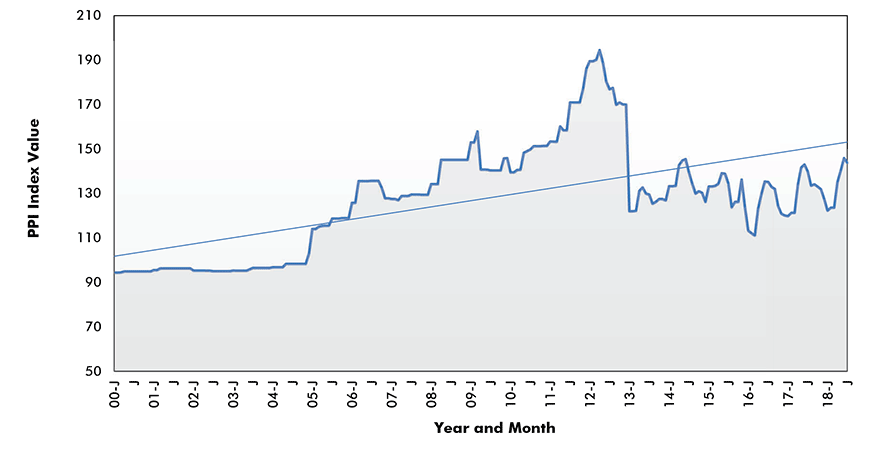
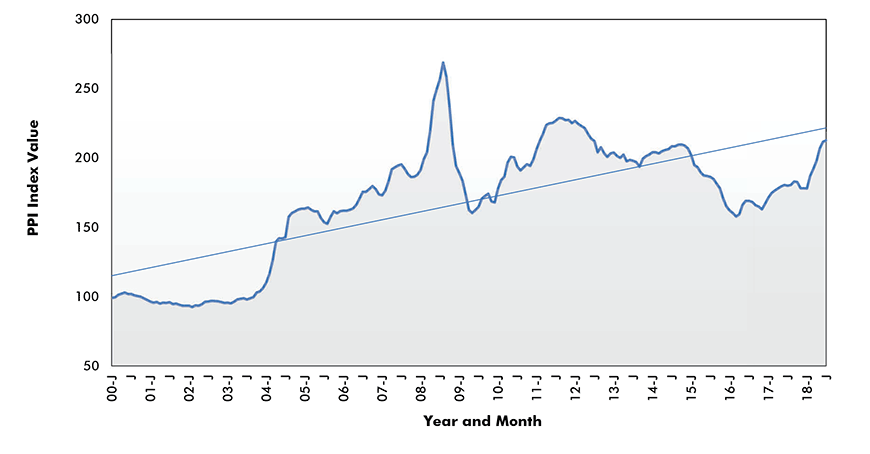
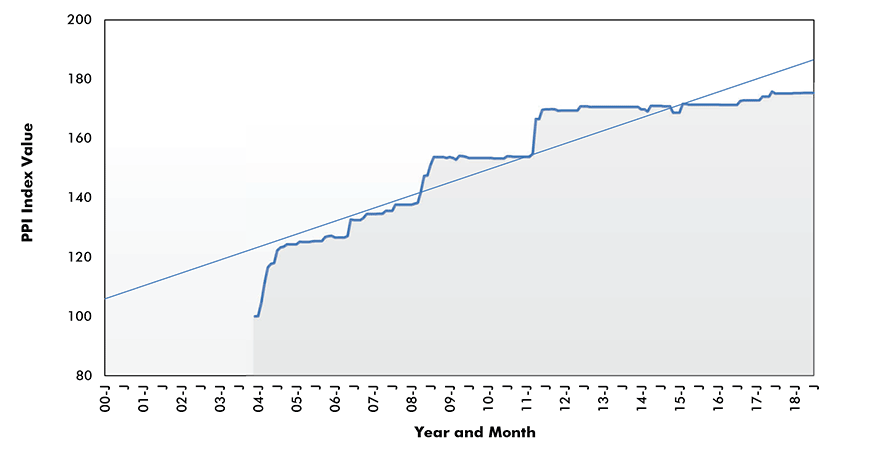
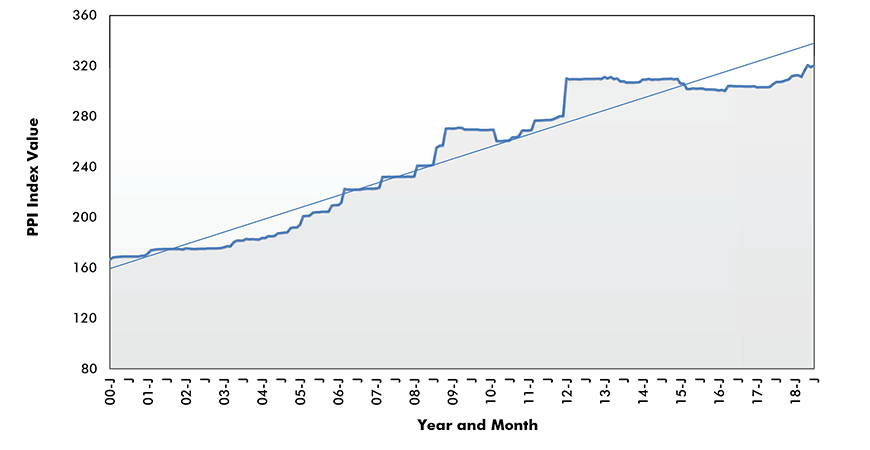
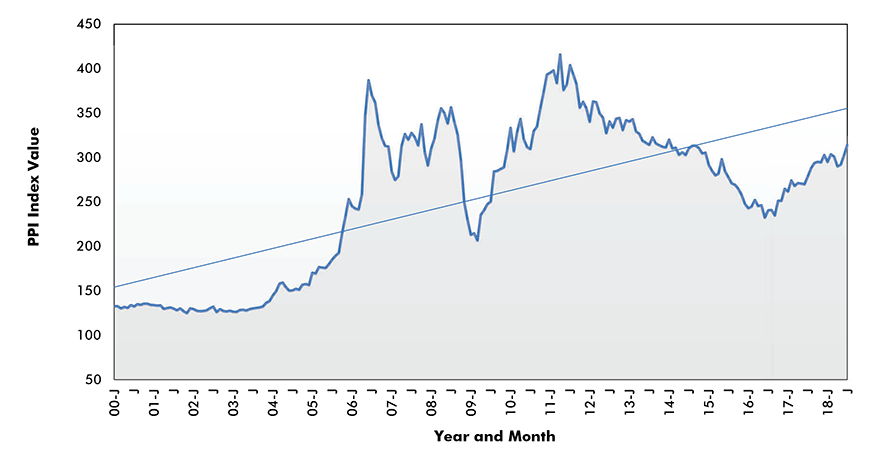
Graph 3, Asphalt:
The price displays a great deal of volatility and the most recent level is still below previous peak.
Graph 3: Asphalt Price Index – U.S. PPI
The last data point is July 2018.
Data source: U.S. Bureau of Labor Statistics (BLS), Producer Price Index (PPI) series, not seasonally adjusted (NSA) / Chart: ConstructConnect.
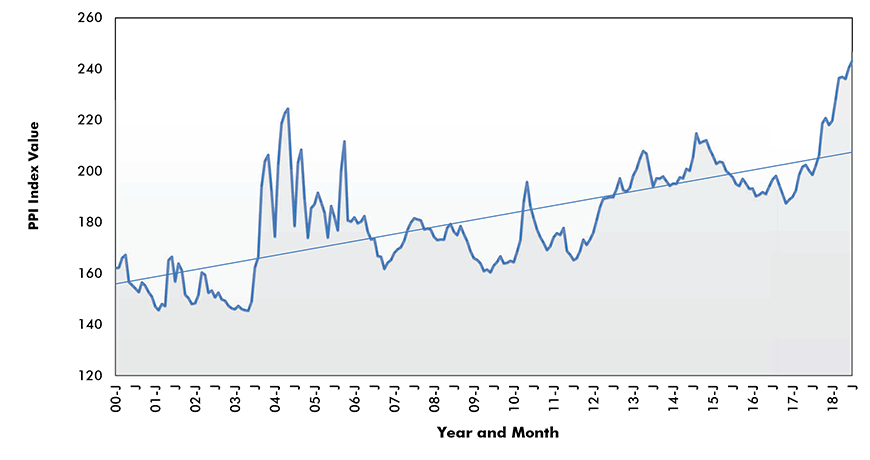
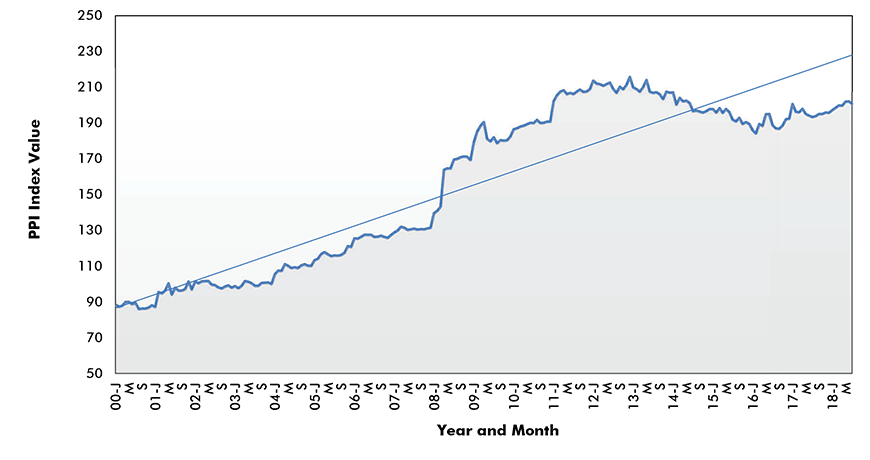
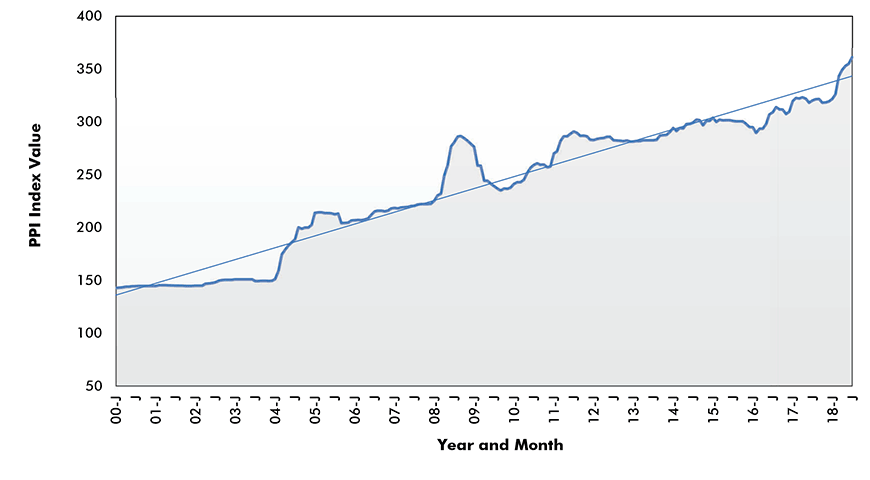
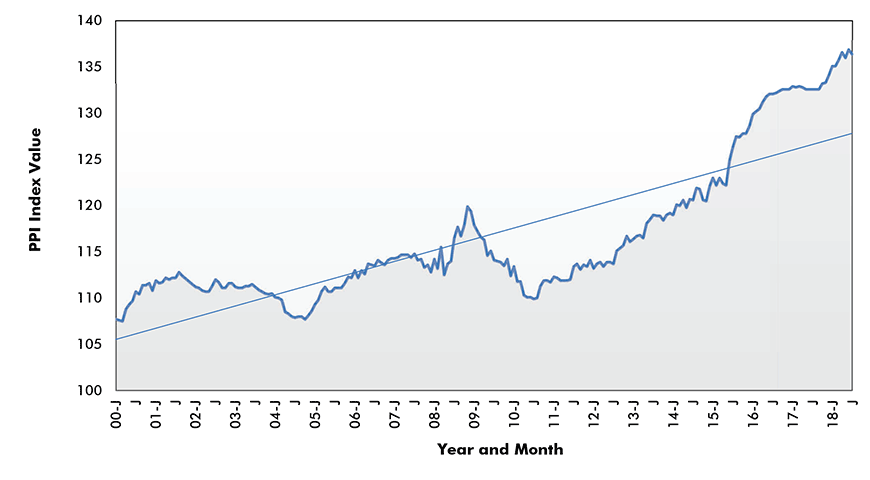
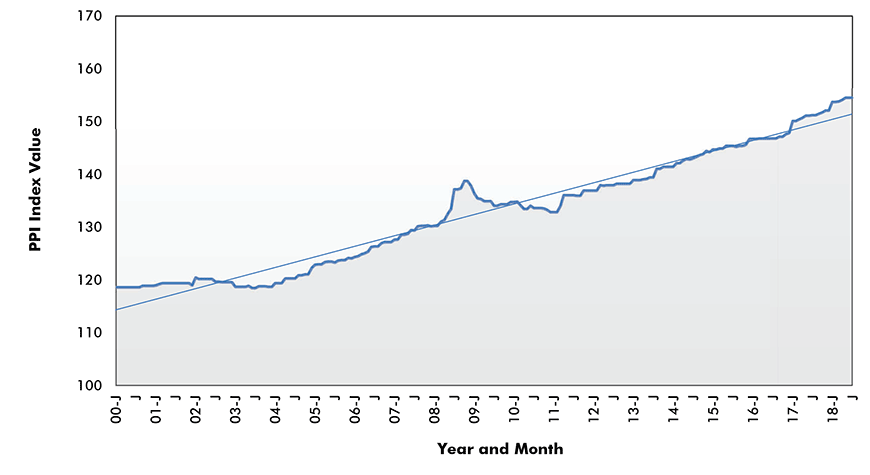
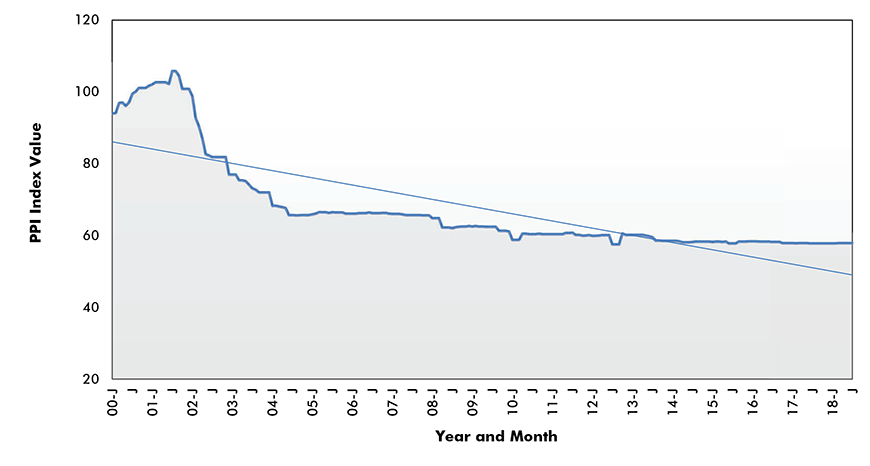
Graph 4, Plastic Construction Products:
The price displays some volatility and the most recent levels combine for a new peak.
The compounding annual rate of increase over the past 18 years has been +2.9%.
Graph 4: Plastic Construction Products Price Index – U.S. PPI
The last data point is July 2018.
Data source: U.S. Bureau of Labor Statistics (BLS), Producer Price Index (PPI) series, not seasonally adjusted (NSA) / Chart: ConstructConnect.
Graph 5, Softwood Lumber:
The price displays a great deal of volatility and the most recent levels combine for a new peak.
Graph 5: Softwood Lumber Price Index – U.S. PPI
The last data point is July 2018.
Data source: U.S. Bureau of Labor Statistics (BLS), Producer Price Index (PPI) series, not seasonally adjusted (NSA) / Chart: ConstructConnect.
Graph 6, Hardwood Lumber:
The price displays considerable volatility and the most recent level has still not quite reached its previous peak.
Graph 6: Hardwood Lumber Price Index – U.S. PPI
The last data point is July 2018.
Data source: U.S. Bureau of Labor Statistics (BLS), Producer Price Index (PPI) series, not seasonally adjusted (NSA) / Chart: ConstructConnect.
Graph 7, Millwork:
The price displays considerable volatility and the most recent level has still not quite reached its previous peak.
Graph 7: Millwork Price Index – U.S. PPI
The last data point is July 2018.
Data source: U.S. Bureau of Labor Statistics (BLS), Producer Price Index (PPI) series, not seasonally adjusted (NSA) / Chart: ConstructConnect.
Graph 8, Plywood:
The price displays considerable volatility and the most recent level is a new peak.
Graph 8: Plywood Price Index – U.S. PPI
The last data point is July 2018.
Data source: U.S. Bureau of Labor Statistics (BLS), Producer Price Index (PPI) series, not seasonally adjusted (NSA) / Chart: ConstructConnect.
Graph 9, Particle Board and Oriented Strandboard (OSB):
The price displays considerable volatility and the most recent level is tied with two previous ‘high-water marks’.
Graph 9: Particle Board and Oriented Strandboard (OSB) Price Index – U.S. PPI
The last data point is July 2018.
Data source: U.S. Bureau of Labor Statistics (BLS), Producer Price Index (PPI) series, not seasonally adjusted (NSA) / Chart: ConstructConnect.
Graph 10, Gypsum:
The price displays considerable volatility and the most recent levels combine for a new peak.
Graph 10: Gypsum Price Index – U.S. PPI
The last data point is July 2018.
Data source: U.S. Bureau of Labor Statistics (BLS), Producer Price Index (PPI) series, not seasonally adjusted (NSA) / Chart: ConstructConnect.
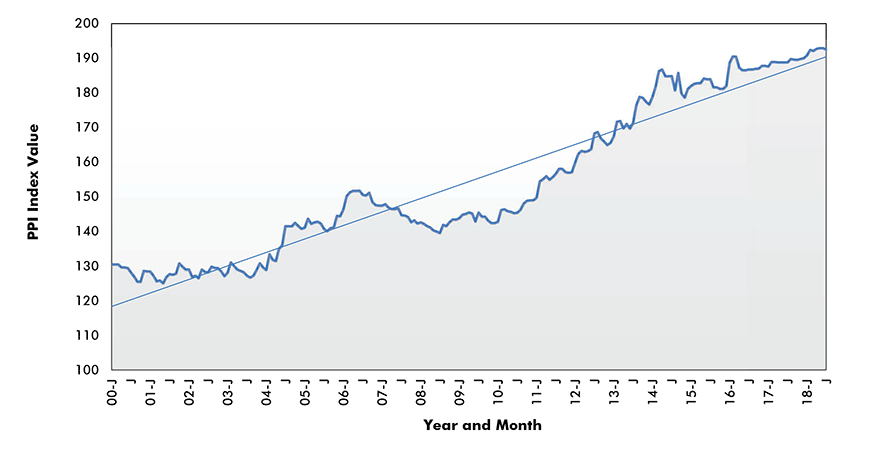
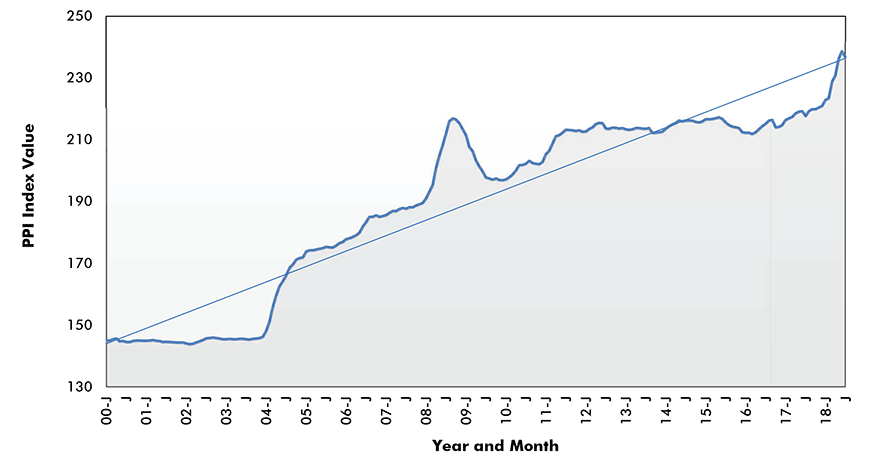
Graph 11, Insulation Materials:
The price displays some volatility and the most recent level is (barely) a new peak.
The compounding annual rate of increase over the past 18 years has been +2.1%.
Graph 11: Insulation Materials Price Index – U.S. PPI
The last data point is July 2018.
Data source: U.S. Bureau of Labor Statistics (BLS), Producer Price Index (PPI) series, not seasonally adjusted (NSA) / Chart: ConstructConnect.
Graph 12, Sand, Gravel and Crushed Stone:
The price displays limited volatility and the curve shows a steady progression upwards. The compounding annual rate of increase over the past 18 years has been +4.0%. (+4.0% per year is a speedy rate of climb.)
Graph 12: Sand, Gravel and Crushed Stone Price Index – U.S. PPI
The last data point is July 2018.
Data source: U.S. Bureau of Labor Statistics (BLS), Producer Price Index (PPI) series, not seasonally adjusted (NSA) / Chart: ConstructConnect.
Graph 13, Cement:
The price displays notable volatility, but the up-and-down phases extend over lengthy periods of time. The curve, long-term, shows a steady progression upwards.
Graph 13: Cement Price Index – U.S. PPI
The last data point is July 2018.
Data source: U.S. Bureau of Labor Statistics (BLS), Producer Price Index (PPI) series, not seasonally adjusted (NSA) / Chart: ConstructConnect.
Graph 14, Ready-mix Concrete:
The price displays some volatility and the curve shows a steady progression upwards. The compounding annual rate of increase over the past 18 years has been +3.3%.
Graph 14: Ready-mix Concrete Price Index – U.S. PPI
The last data point is July 2018.
Data source: U.S. Bureau of Labor Statistics (BLS), Producer Price Index (PPI) series, not seasonally adjusted (NSA) / Chart: ConstructConnect.
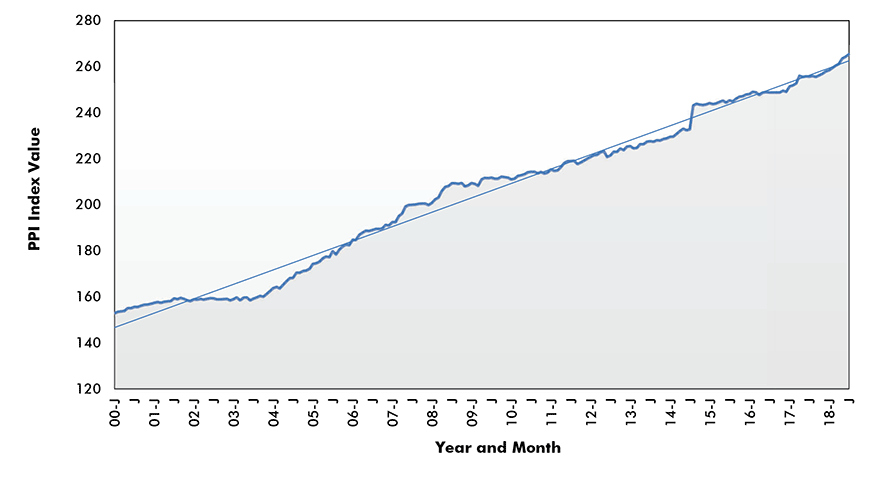
Graph 15, Precast Concrete Products:
The price displays minimal volatility and the curve shows a steady progression upwards. The compounding annual rate of increase over the past 18 years has been +3.0%.
Graph 15: Precast Concrete Products Price Index – U.S. PPI
The last data point is July 2018.
Data source: U.S. Bureau of Labor Statistics (BLS), Producer Price Index (PPI) series, not seasonally adjusted (NSA) / Chart: ConstructConnect.
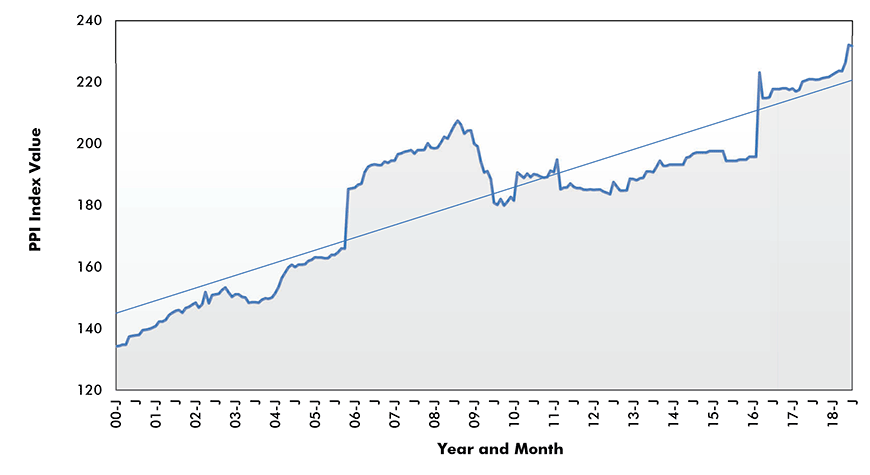
Graph 16, Prestressed Concrete Products:
The price displays considerable volatility, although the curve does show a steady progression upwards. The most recent level is a new peak.
Graph 16: Prestressed Concrete Products Price Index – U.S. PPI
The last data point is July 2018.
Data source: U.S. Bureau of Labor Statistics (BLS), Producer Price Index (PPI) series, not seasonally adjusted (NSA) / Chart: ConstructConnect.
Graph 17, Clay Brick:
The price rose significantly from 2000 to 2006, but it has been essentially flat (with a small dip from 2011-2015) since then.
Graph 17: Clay Brick Price Index – U.S. PPI
The last data point is July 2018.
Data source: U.S. Bureau of Labor Statistics (BLS), Producer Price Index (PPI) series, not seasonally adjusted (NSA) / Chart: ConstructConnect.
Graph 18, Coal:
The price displays some volatility and its most recent level remains below previous peak.
Graph 18: Coal Price Index – U.S. PPI
The last data point is July 2018.
Data source: U.S. Bureau of Labor Statistics (BLS), Producer Price Index (PPI) series, not seasonally adjusted (NSA) / Chart: ConstructConnect.
Graph 19, Iron Ore:
The price displays considerable volatility, but the long-term shape of the curve – as captured by the horizontal trend line − is nearly flat.
Graph 19: Iron Ore Price Index – U.S. PPI
The last data point is July 2018.
Data source: U.S. Bureau of Labor Statistics (BLS), Producer Price Index (PPI) series, not seasonally adjusted (NSA) / Chart: ConstructConnect.
Graph 20, Iron and Steel Scrap:
The price displays a great deal of volatility and the most recent level has still not returned to its previous heights.
Graph 20: Iron and Steel Scrap Price Index – U.S. PPI
The last data point is July 2018.
Data source: U.S. Bureau of Labor Statistics (BLS), Producer Price Index (PPI) series, not seasonally adjusted (NSA) / Chart: ConstructConnect.
Graph 21, Steel Bars, Plates and Structural Shapes:
The price displays considerable volatility and the most recent level has still not returned to its previous heights.
Graph 21: Steel Bars, Plates and Structural Shapes Price Index – U.S. PPI
The last data point is July 2018.
Data source: U.S. Bureau of Labor Statistics (BLS), Producer Price Index (PPI) series, not seasonally adjusted (NSA) / Chart: ConstructConnect.
Graph 22, Steel Pipe and Tube:
The price displays considerable volatility, but the most recent level is matching previous peaks.
Graph 22: Steel Pipe and Tube Price Index – U.S. PPI
The last data point is July 2018.
Data source: U.S. Bureau of Labor Statistics (BLS), Producer Price Index (PPI) series, not seasonally adjusted (NSA) / Chart: ConstructConnect.
Graph 23, Fabricated Structural Metal Products:
The price displays some volatility and the most recent level has ascended to a new peak.
Graph 23: Fabricated Structural Metal Products Price Index – U.S. PPI
The last data point is July 2018.
Data source: U.S. Bureau of Labor Statistics (BLS), Producer Price Index (PPI) series, not seasonally adjusted (NSA) / Chart: ConstructConnect.
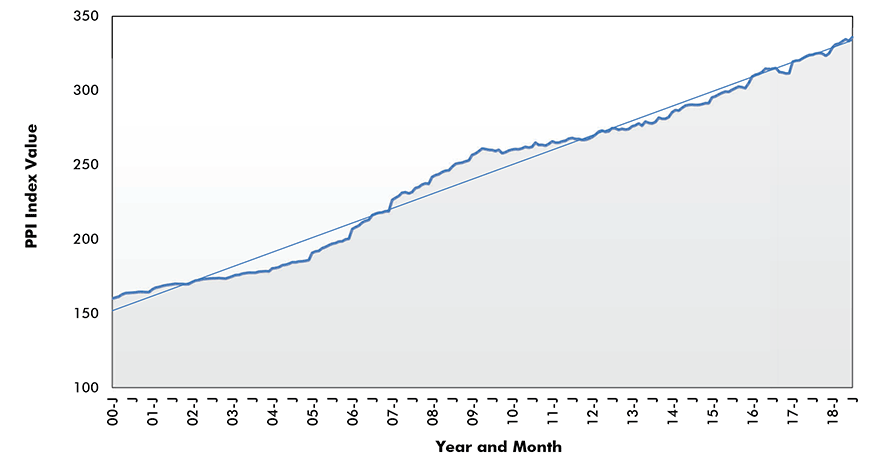
Graph 24, Prefabricated Metal Buildings:
The price displays limited volatility and the curve shows a steady progression upwards. The compounding annual rate of increase over the past 18 years has been +5.0%. (Such a large price hike per year maintained for almost 20 years is exceptional.)
Graph 24: Prefabricated Metal Buildings Price Index – U.S. PPI
The last data point is July 2018.
Data source: U.S. Bureau of Labor Statistics (BLS), Producer Price Index (PPI) series, not seasonally adjusted (NSA) / Chart: ConstructConnect.
Graph 25, Metal Valves:
The price displays minimal volatility and the curve shows a steady upwards progression. The compounding annual rate of increase has been +3.8%.
Graph 25: Metal Valves Price Index – U.S. PPI
The last data point is July 2018.
Data source: U.S. Bureau of Labor Statistics (BLS), Producer Price Index (PPI) series, not seasonally adjusted (NSA) / Chart: ConstructConnect.
Graph 26, Aluminum Mill Shapes:
The price displays considerable volatility and the most recent levels have combined for a new peak. Tariffs on aluminum imports are allowing domestic producers to bump up their ‘sticker’ prices.
Graph 26: Aluminum Mill Shapes Price Index – U.S. PPI
The last data point is July 2018.
Data source: U.S. Bureau of Labor Statistics (BLS), Producer Price Index (PPI) series, not seasonally adjusted (NSA) / Chart: ConstructConnect.
Graph 27, Sheet Metal Ducting:
From 2004 to 2011, the price moved higher in clearly defined steps. Over the past eight years, the price has stayed level.
Graph 27: Sheet Metal Ducting Price Index – U.S. PPI
The last data point is July 2018.
Data source: U.S. Bureau of Labor Statistics (BLS), Producer Price Index (PPI) series, not seasonally adjusted (NSA) / Chart: ConstructConnect.
Graph 28, Flat Glass:
The price displays some volatility, although it has been moving steadily higher since mid-2010. From 2013 onwards, the upward flight has taken the price far beyond its previous peak.
Graph 28: Flat Glass Price Index – U.S. PPI
The last data point is July 2018.
Data source: U.S. Bureau of Labor Statistics (BLS), Producer Price Index (PPI) series, not seasonally adjusted (NSA) / Chart: ConstructConnect.
Graph 29, Indoor and Outdoor Paints:
The price displayed some minor volatility from 2000 through 2012, but it has flattened out since then – although there has been a slight elevation of the curve over the past year.
Graph 29: Indoor and Outdoor Paints Price Index – U.S. PPI
The last data point is July 2018.
Data source: U.S. Bureau of Labor Statistics (BLS), Producer Price Index (PPI) series, not seasonally adjusted (NSA) / Chart: ConstructConnect.
Graph 30, Lighting Fixtures:
The price displays minimal volatility and the curve shows a steady progression upwards. The compounding annual rate of increase over the past 18 years has been +1.3%.
Graph 30: Lighting Fixtures Price Index – U.S. PPI
The last data point is July 2018.
Data source: U.S. Bureau of Labor Statistics (BLS), Producer Price Index (PPI) series, not seasonally adjusted (NSA) / Chart: ConstructConnect.
Graph 31, Plumbing Fixtures and Fittings:
The price displays minimal volatility and the curve shows a steady progression upwards. The compounding annual rate of increase over the past 18 years has been +2.2%.
Graph 31: Plumbing Fixtures and Fittings Price Index – U.S. PPI
The last data point is July 2018.
Data source: U.S. Bureau of Labor Statistics (BLS), Producer Price Index (PPI) series, not seasonally adjusted (NSA) / Chart: ConstructConnect.
Graph 32, Elevators and Escalators:
The price displays minimal volatility and the slope of the curve climbs steadily upwards. The compounding annual rate of increase over the past 18 years has been +1.4%.
Graph 32: Elevators and Escalators Price Index – U.S. PPI
The last data point is July 2018.
Data source: U.S. Bureau of Labor Statistics (BLS), Producer Price Index (PPI) series, not seasonally adjusted (NSA) / Chart: ConstructConnect.
Graph 33, Heating Equipment:
The price displays a minor degree of volatility and the curve shows a steady progression upwards. The compounding annual rate of increase over the past 18 years has been +3.0%.
Graph 33: Heating Equipment Price Index – U.S. PPI
The last data point is July 2018.
Data source: U.S. Bureau of Labor Statistics (BLS), Producer Price Index (PPI) series, not seasonally adjusted (NSA) / Chart: ConstructConnect.
Graph 34, Air Conditioning Equipment:
The price displays a minor degree of volatility and the curve shows a steady progression upwards. The compounding annual rate of increase over the past 18 years has been +1.9%. Note that the year-over-year rate of increase for air conditioning equipment has been less than two-thirds of what has prevailed for heating equipment.
Graph 34: Air Conditioning Equipment Price Index – U.S. PPI
The last data point is July 2018.
Data source: U.S. Bureau of Labor Statistics (BLS), Producer Price Index (PPI) series, not seasonally adjusted (NSA) / Chart: ConstructConnect.
Graph 35, Copper Wire and Cable:
The price displays considerable volatility and the most recent level is still well below prior heights.
Graph 35: Copper Wire and Cable Price Index – U.S. PPI
The last data point is July 2018.
Data source: U.S. Bureau of Labor Statistics (BLS), Producer Price Index (PPI) series, not seasonally adjusted (NSA) / Chart: ConstructConnect.
Graph 36, Fiber Optic Cable:
The price fell steeply from 2002 to 2004 and has shown some further minor softening since then.
Graph 36: Fiber Optic Cable Price Index – U.S. PPI
The last data point is July 2018.
Data source: U.S. Bureau of Labor Statistics (BLS), Producer Price Index (PPI) series, not seasonally adjusted (NSA) / Chart: ConstructConnect.
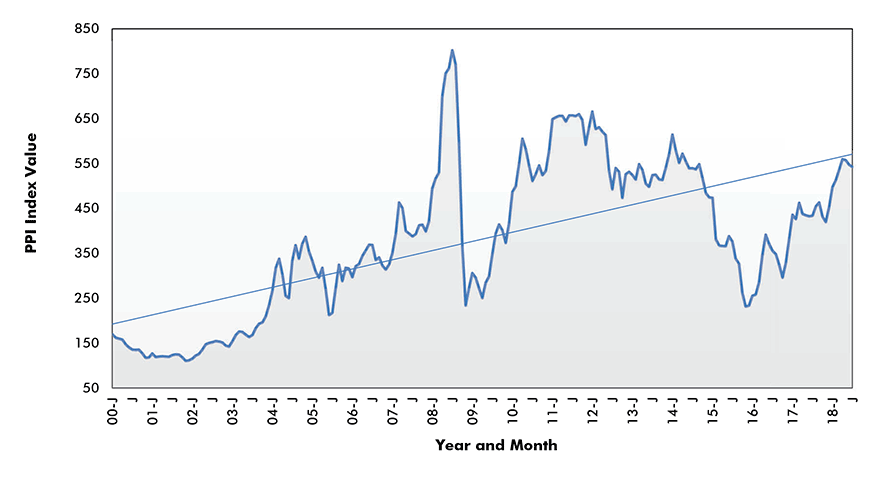
Graph 37, Regular Unleaded Gasoline:
The price displays a great deal of volatility and the most recent level, while on an upswing, continues to fall short of previous peaks.
Graph 37: Regular Unleaded Gasoline Price Index – U.S. PPI
The last data point is July 2018.
Data source: U.S. Bureau of Labor Statistics (BLS), Producer Price Index (PPI) series, not seasonally adjusted (NSA) / Chart: ConstructConnect.
Graph 38, Diesel Fuel:
The price displays considerable volatility and the most recent level remains under previous peaks.
Graph 38: Diesel Fuel Price Index – U.S. PPI
The last data point is July 2018.
Data source: U.S. Bureau of Labor Statistics (BLS), Producer Price Index (PPI) series, not seasonally adjusted (NSA) / Chart: ConstructConnect.
Graph 39, Natural Gas:
The price displays considerable volatility but has generally been trending down for years.
Graph 39: Natural Gas Price Index – U.S. PPI
The last data point is July 2018.
Data source: U.S. Bureau of Labor Statistics (BLS), Producer Price Index (PPI) series, not seasonally adjusted (NSA) / Chart: ConstructConnect.
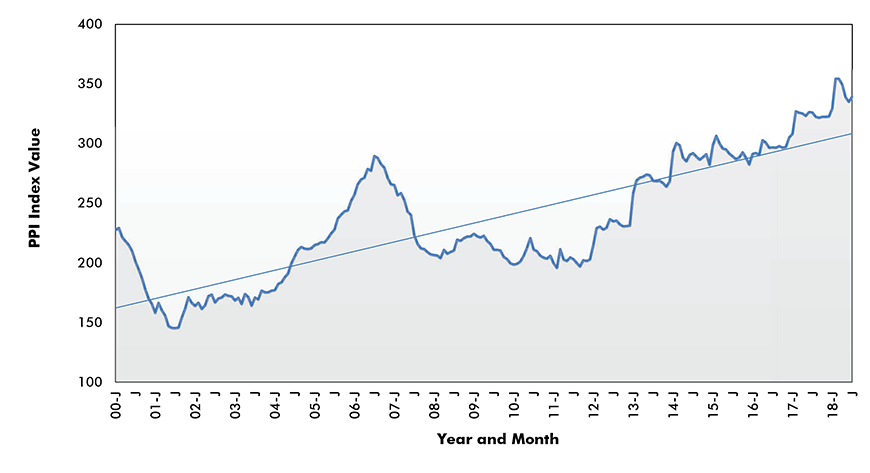
Graph 40, Goods Inputs to New Construction:
The ‘overall’ index displays a good deal of volatility and the most recent level is a new peak. The compounding annual rate of advance over the past 18 years has been +2.8%.
Graph 40: Goods Inputs to New Construction Price Index – U.S. PPI
The last data point is July 2018.
Data source: U.S. Bureau of Labor Statistics (BLS), Producer Price Index (PPI) series, not seasonally adjusted (NSA) / Chart: ConstructConnect.
Read the related articles: “U.S. Construction Costs Are Soaring“; “Canada’s Construction Material Costs +6.6% Y/Y in July” and ““Infographic: Construction is costing more“.











Recent Comments
comments for this post are closed