Providing they enable vehicles and people to cross them without any problems, bridges are pretty boring. However, when one suddenly collapses as the Morandi Bridge did in Genoa in mid-August, killing 37 people, it’s a big deal. Moreover, over the past five years, five Italian bridges have collapsed and like the Morandi bridge they were all built during Italy’s building boom in the 1960s. According to informed sources, more than 300 Italian bridges are at risk.
With the pictures of the Morandi bridge collapse still fresh in the minds of many drivers and pedestrians, Statistics Canada in partnership with Infrastructure Canada has just released a very comprehensive report on the health of Canada’s roads, bridges and tunnels. The report, based on the responses of approximately 1,500 government organizations, covers nine asset classes that are outlined in the methodology in the Statistics Canada Daily of August 24, 2018. The respondents to the survey were asked to rate the condition of each class of physical asset as: (1) “very poor” — unfit for sustained service and at or beyond its service life; (2) “poor” — near the end of its service life; (3) “fair”— shows signs of deterioration and requires attention; (4) “good” — acceptable and within the middle of its service life; and (5) “very good” — well maintained in good condition, new or recently renovated.
The survey identified 47,279 publicly owned bridges in Canada, the majority 14,499 (31%) of which are located in Ontario, home to the bulk (38%) of the country’s population. The relationship between population and number of bridges is not a consistent one. Although it is home to just over 12% of Canadians, Alberta has 21.5% of the country’s bridges while Quebec, where 23% of Canadians reside, has 8,075 bridges, 17% of the nation’s total.
Based on the self assessments of the condition of their bridges by provincial, regional and municipal governments across the country, Canada’s publicly owned bridges are, on balance, in reasonably good shape.
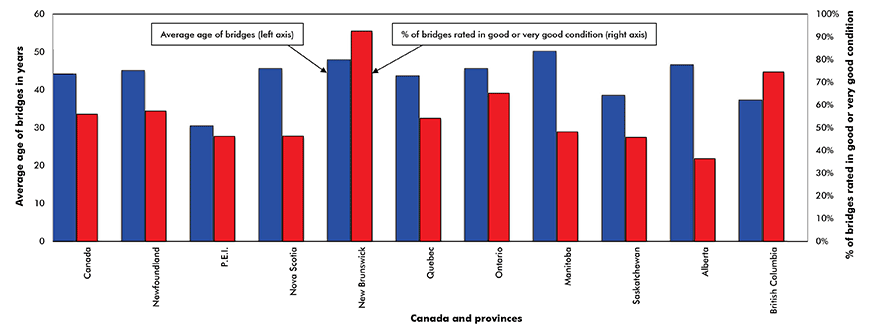
In 2016, 56% were rated in good or very good condition. Across the country, the condition of bridges in New Brunswick, where 92.5% are rated good or very good, stands head and shoulders above the rest of the country.
Other provinces where the percentage of bridges rated in good or very good condition was above the national average included British Columbia (74.6%), Ontario (65.2%) and Newfoundland (57.3%). At the other end of the quality spectrum, the survey reported that 28.9% of Saskatchewan’s bridges were rated in poor or very poor condition while 27.3% of Prince Edward Island’s 245 bridges were also definitely in need of work.
Three other provinces with an above average share of bridges in poor or very poor condition were Quebec (19.1%), Manitoba (16.2%) and Nova Scotia (14.9%). Provinces with the smallest percentage of bridges needing work include New Brunswick (1%), British Columbia (3.1%) and Alberta (10.3%).
In addition to ranking bridges according to the above noted subjective scale, respondents were asked to report: (1) the average age of bridges within their jurisdiction and (2) to indicate the expected service life of each type of bridge.
For the country as a whole, the expected service life of bridges built in 2016 was 68 years for highway/expressway bridges, 67 years for arterial bridges and 66 years for collector bridges. Local bridges are, on average, expected to last 48 years and foot bridges, 51 years. Applying these life expectancies to the total population of bridges, we find that the majority are definitely well into middle age. Across the five major types of bridges, 80% of highway and expressway bridges were built between 1940 and 1999 along with 75% of arterial bridges and 73% of collector bridges.
Provinces with the highest percentage of “middle-aged” bridges (i.e built prior to 1970) include Manitoba (54%), Alberta (51%), Ontario (49%) and Nova Scotia (47%).
In summary, although a significant proportion of the country’s 47,000+ publicly owned bridges are well into middle age, we don’t expect any to suffer the fate of the Morandi Bridge any time soon.
However, in light of the fact that a significant portion of our bridges are close to the end of their service life, they will require a major infusion of resources in order keep our national transportation system in good health.
Canadian bridges – average age and percentage rated in “good” and “very good” condition

Chart: ConstructConnect – CanaData.


Recent Comments
comments for this post are closed