Not-so-long-age, gasoline ruled as the fuel of choice to propel the U.S. and Canadian economies forward. In the world of tomorrow, due to its more environmentally-friendly properties, electricity seems likely to become supreme.

What this article will explore is various aspects – with an emphasis on construction implications – of the rise to prominence of electricity.
I think the reader will find there’s a compelling narrative with some sharp-angled turns. Plus, there’s a cliffhanger ending, implying that many chapters remain to be written.
Let’s begin near the turn of the millennium.
While burning gasoline results in nasty carbon emissions, consuming electricity is ‘clean’. But at the ‘back end’, electricity comes with considerable baggage.
Historically, the generation of electric power has made a great deal of use of fossil fuels.
Traditionally, there have been four chief feedstocks to drive turbines – coal, natural gas, nuclear and hydroelectric.
Since 2001, the proportion of U.S. electric power generation that has been derived by nuclear means has stayed at an almost constant 20%. Nuclear has fallen out of favor over the question of what to do with the spent ‘rods’. And the fear of fallout from a natural or man-made disaster.
Since 2001, the proportion of U.S. electricity coming from hydroelectric sources has similarly remained almost fixed, at between 6% and 8%. Unfortunately, almost all the water systems in the country offering the potential for dams and penstocks have already been tapped.
As Graph 1 shows, coal was the first-place choice for heating water to create steam to turn generators right up until 2008. Only after 2008, did coal’s role as a fuel source for American electricity drop below half or 50%.
Over the years, the importance of natural gas in the creation of electricity has been rising steadily. It began this century providing less power than nuclear, but there was a crossover year in 2006.
Usage of natural gas really sped up in 2012 and it managed to catch coal’s diminished position in 2015.
In the latest full year, 2017, the shares of U.S. power generation provided by the four main fuel sources were: natural gas, 32%; coal, 30%; nuclear, 20%; and hydroelectric, 8%.
The remaining 10% was a combination of solar, wind, geothermal and biomass (e.g., from wood chips).
Graph 1: U.S. Electric Power Generation – Fuel Sources
Graphs 2 and 3 reinforce the message about the reversal in coal’s fortunes versus those of natural gas. Graph 2 highlights the downward slide that coal has experienced in power generation. Graph 3 illustrates the greatly expanded usage of natural gas.
The ascendancy of natural gas over coal in power generation has been welcomed because the former leaves a smaller carbon footprint than the latter.
The switchover has not been entirely due to an enlightened public attitude. Instead, there have been fortuitous economic circumstances at work in the background.
Graph 2: Coal Consumption by U.S. Electric Power Sector
Graph 3: Natural Gas Consumption by U.S. Electric Power Sector
Graph 4 sets out U.S. natural gas production during the past 17 years. Over most of the period covered, there’s been a steeply climbing slope. The credit for the rising level of production goes to extraction of gas through a more wide-spread adoption of an innovative technology, hydraulic fracturing.
Hydraulic fracturing allows horizontal drilling and releases gas through breaking up shale rock.
Further confirming the enormous increase in U.S. natural gas output has been the decline in the need for imports from Canada.
Graph 4: U.S. Natural Gas Production
Canada’s foreign trade in natural gas is set out in Graph 5. With little in the way of LNG capacity at present, − although there are big dreams for more further down the road − Canada basically ships natural gas to only one outside customer, the U.S.
After 2008, Canadian gas exports (i.e., U.S. gas imports) plummeted. They were no longer required to the same degree south of the border.
Graph 5: Canada’s Foreign Trade in Natural Gas
A natural consequence of the surge in U.S. natural gas output has been a drop in the price. In late 2005 and again in 2008, natural gas was selling for about $13.00 per million BTUs. As production increasingly ramped up in ensuing years, the price fell.
From Graph 6, Henry Hub natural gas spot prices have been mainly close to $3.00 per million BTUs since 2015.
During the past decade, there has been a cost incentive to move away from coal-fired power generation towards natural gas-fired units.
Graph 6: U.S. Henry Hub Natural Gas Spot Price
Nor is an immediate end to this trend apparent. Map 1 shows the primary fuel source used for power generation in each U.S. state.
Along the three coastlines, power generation is dominated by natural gas, hydroelectric and nuclear. Many of those states have already taken the difficult step of shifting away from coal.
Power generation in the vast middle of the country, however, – with the exceptions of South Dakota and Illinois – is still mostly dependent on ‘black gold’.
In the 18 states with dark gray shading (for coal), there is strong potential for capital spending on alternative means of power generation.
Map 1: Electric Power Generation in States, Primary Fuel Source
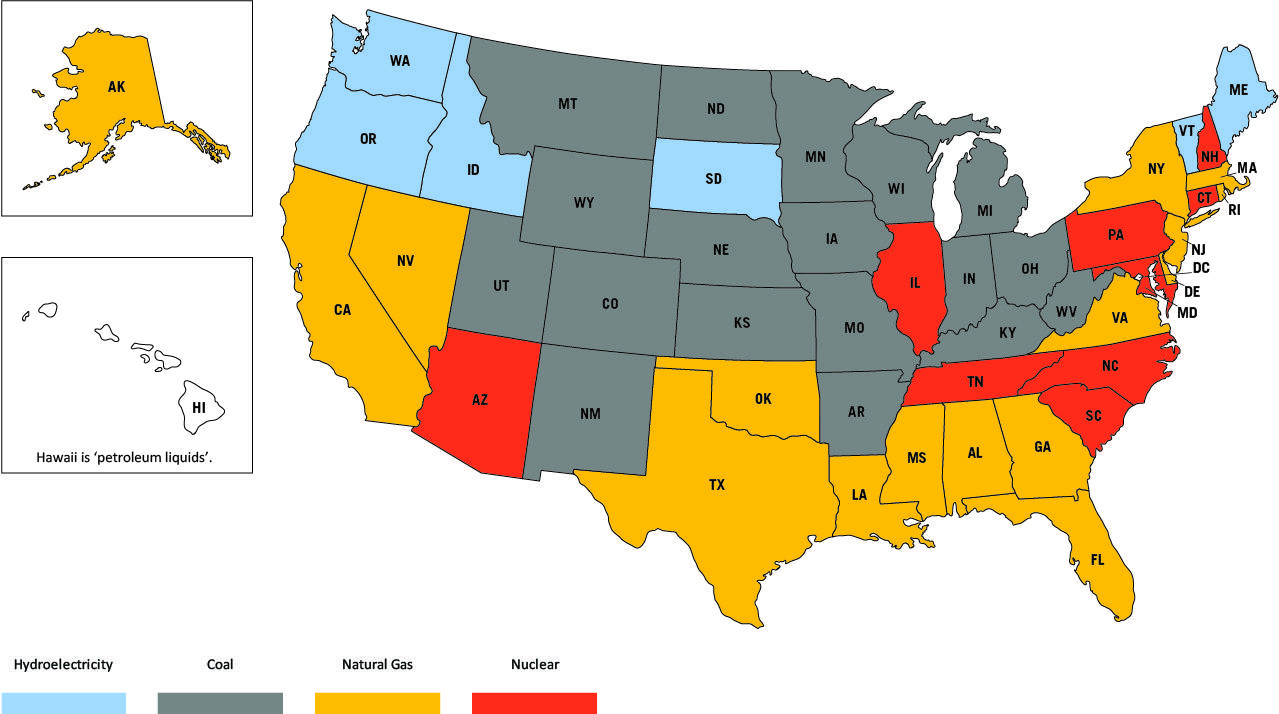
Data source: U.S. Energy Information Administration (EIA).
Map: ConstructConnect.
Map 2 is for the provinces of Canada and only in Saskatchewan and Alberta is coal still king in electricity production.
Map 2: Electric Power Generation in Provinces & Territories, Primary Fuel Source
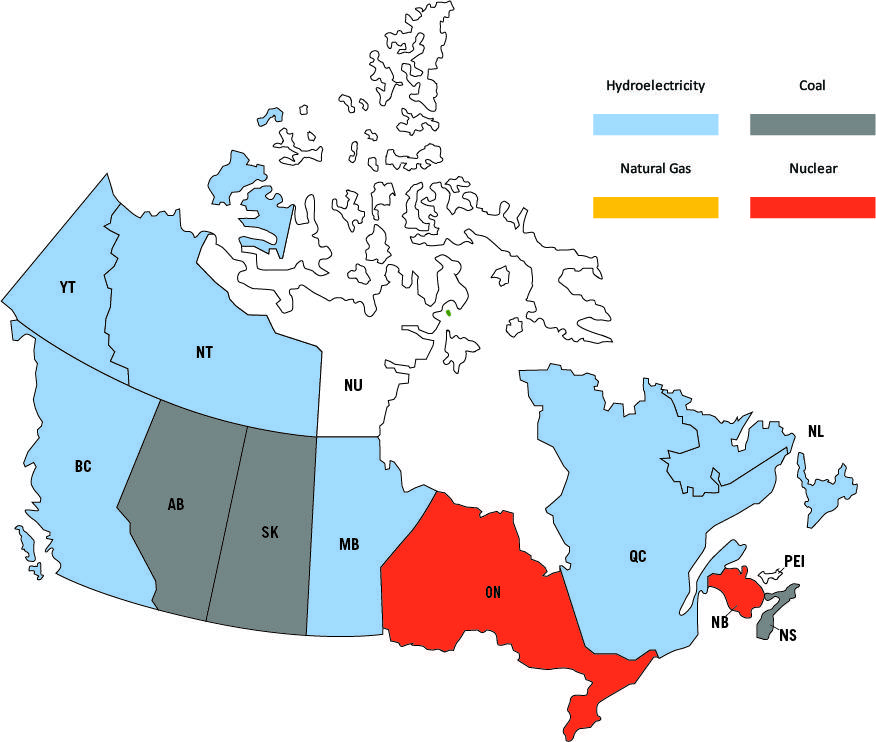
P.E.I. is wind farms, although it imports most of its electricity from N.B.
Nunavut is diesel fuel imported into the region in the summer.
Data source: National Energy Board (NEB).
Map: ConstructConnect.
What has all of this meant for the construction sector?
For starters, there has been strong activity in either converting existing power generating units from coal to natural gas, or in the building of new natural gas-fired stations.
There has also been a need for expansions to pipeline capacity. Mega pipeline projects – to service residential, commercial, industrial and power plant customers − have become more prominent in ConstructConnect’s starts statistics.
I promised some surprises at the end of this tale about electric power generation.
Since the election of Mr. Trump as President, there has been an emphasis in Washington’s energy policy approach to restore a measure of vitality to the U.S. coal industry. Therefore, the switchover from coal-fired power plants to natural gas and ‘renewables’ may not proceed at the same rapid pace as once expected.
Even more of a shock, though, has been the recent trend in electricity usage. From 2001 to 2007, electric power consumption in the U.S. skyrocketed. Nearly everyone, from stock market analysts to energy experts, expected that pattern to continue.
But prodigious conservation measures, undertaken willingly by homeowners and businesses and built into electronic devices and appliances, have restrained the growth of demand.
Graph 7 establishes a leveling off in U.S. electricity demand that has now gone on for a dozen years.
Graph 7: U.S. Electricity Consumption
For now, this is where the saga leaves off. One thing is certain, though. There will be many more chapters written in the years ahead.


Recent Comments
comments for this post are closed