Although the recent explosion at the Irving Oil refinery caused a significant amount of damage and may temporarily disrupt the plant’s operations, it is unlikely to have a permanent impact on New Brunswick’s medium-term economic prospects.
Further, the recently negotiated USMCA trade agreement has lifted a major cloud of uncertainty which was overshadowing the province’s future trade relations with the United States, the market for 93% of its total exports. Indeed, driven by sustained strong growth in the U.S., New Brunswick’s exports have increased by 12.4% year to date, just slightly slower than the 13.5% year-to-date increase they posted during the first eight months of 2017.
Despite the strong export growth over the past year-and-a-half, job creation in “the Picture Province” can best be described as anemic. Over the past twelve months, the province has added just 1,500 jobs, almost all of which (1,400) are part-time.
Moreover, all of the jobs added were in the public sector, more than offsetting a retreat in private-sector hiring. From an industry perspective, employment in services posted the largest gain while the goods-producing sector saw hiring shrink by 1,400 due to losses in manufacturing and construction. Looking ahead, the most recent CFIB Business Barometer suggests that firms in New Brunswick are maintaining their very cautious approach about adding staff. However, with the province’s job vacancy rate at a 14-year high, this hesitancy may be due to a shortage of qualified job applicants.
While the external side of the New Brunswick economy is doing quite well, the domestic side is in the doldrums. In line with the weak pattern of job creation over the past 24 months, the value of retail sales year to date, adjusted for inflation, is down by -0.3%, well below the 3.3% gain they posted during the first seven months of 2017.
Weak sales of both new and used motor vehicles more than offset gains in sales of building materials, auto parts and food and beverage stores.
Weak job growth and the more restrictive mortgage approval regulations introduced by the Office of the Superintendent of Financial Institutions at the beginning of the year appear to have exerted a drag on housing demand in New Brunswick over the past nine months.
After posting a 6.5% year-to-date gain in the first nine months of 2017, sales of existing homes are little changed during the comparable period this year. Cooling demand and evidence of excess supply have contributed to a significant slowdown in new residential construction.
So far this year, housing starts are down 6.7%, largely on account of a 17% drop in apartment starts and a slight 1.2% decline in single-family starts.
Looking forward, despite sustained, relatively strong net migration in the first half of this year, we expect that higher interest rates and an ample supply of existing homes for sale will cause starts to be in the range of 1,900 to 2,200 units this year and next compared to 2,300 in 2017.
Initial expectations about the outlook for capital spending in New Brunswick were very subdued after Statistics Canada released its Survey of Non-residential Capital and Repair Expenditures (CAPEX) report in February. After posting a gain of 7.4% in 2017, the CAPEX survey projected a 2.1% increase in spending in 2018, a five-year low.
More recent data suggests that public organizations and private sector firms are investing more than they initially projected. In the first six months of this year, the total value of non-residential building construction in the province is up by 22%, largely on account of a 70% increase in institutional construction together with a 9% rise in commercial building.
While non-res capital spending will be underpinned by ongoing spending on the TransAqua Wastewater project and on upgrades to the Irving Oil Refinery, the 24% year-to-date decline in the value of the province’s non-res building permits suggests that non-res capital spending will moderate during the remainder of this year and into 2019.
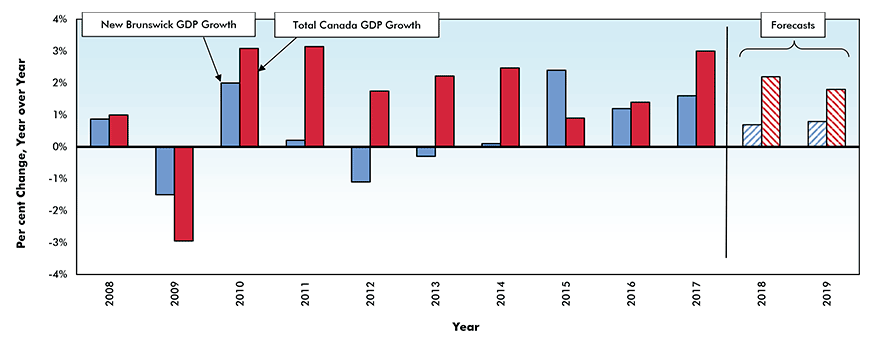
Real* Gross Domestic Product (GDP) Growth — New Brunswick vs Canada

Chart: ConstructConnect – CanaData.


Recent Comments