There’s good reason to feel comfortable based on how well the U.S. economy is doing in terms of job creation, low unemployment rate, consumer confidence and quarter-to-quarter gross domestic product (GDP) growth.

But there are also shadows at the edges that are unsettling. The Chairman of the Federal Reserve has stated an intention to increase the central bank’s policy-setting interest rate to 3.00%. The federal funds rate currently sits in a range between 2.00% and 2.25%. Higher interest costs will dampen housing- and car-buying demand.
The federal government’s annual deficit is rising and appears headed towards $1 trillion. And there are many corporations with unpleasant debt levels that will become harder to service as interest rates climb.
The headline inflation rate (i.e., the ‘all-items’ Consumer Price Index/CPI) remains barely above the acceptable +2.0% level, but there are shifts in the background that suggest a wave of more elevated increases may be coming. Wages are more emphatically moving higher, which improves prospects for consumer spending, but also lifts costs. Tariffs on many import products are making materials pricier.
The results of the mid-term election, with the Democrats taking over the House, may erect an obstacle to the early and easy ratification of the USMCA trade agreement. And for stock market investors, long-favored high-tech star performers on the NASDAQ exchange have recently lost some of their glow.
Furthermore, old-style attempts at deductive reasoning to sort out what the future may hold are proving inadequate. For example, in Washington, efforts to set policy through negotiation by lawmakers are being superseded by hard-to-anticipate executive orders and ubiquitous court challenges.
With the foregoing as backdrop, there are the following additional ‘nuggets’ to consider, derived from the latest public and private sector data releases.
(1) A still common assertion is that inflation remains subdued in the U.S. True enough, the latest year-over-year increase in the ‘all-items’ Consumer Price Index (CPI) has been a relatively mild +2.3%, with the ‘core’ rate (which omits volatile energy and food products) slightly less at +2.2%. Behind the scenes, however, there are numerous instances of costs bubbling up. Consider the following year-over-year changes in the Producer Price Index (PPI) series for some key construction inputs: asphalt, +51.3%; steel pipe and tube, +22.1%; hot rolled steel bars, plates and structural shapes, +18.8%; diesel fuel, +27.0%; prefabricated metal buildings, +14.3%; aluminum mill shapes, +8.2%; insulation materials, +6.3%; and heating equipment, +5.9%.
(2) The PPI’s ‘inputs to new construction’ index is +6.6% year over year. The increase in the PPI’s ‘inputs to highways and streets’ index is even more robust, at +8.7% year over year. Among all the PPI data, there is a broader measure of the cost of assembling projects entitled the ‘final demand construction’ index and it is +4.7% year over year. There are also ‘final demand’ indices for specific types of structures. Currently, the results are +3.7% y/y for new warehouse building construction; +5.2% for new school building construction; +5.0% for new office buildings; +3.7% for new industrial buildings; and +4.3% for new health care building construction.
(3) From statistics compiled by the National Association of Realtors (NAR), the current (Q3 2018) Top 10 ordering of major cities by median sales price for existing single-family homes is: San Jose, $1.3 million (+11.6% y/y); San Francisco, $989,000 (+9.9%); San Diego, $650,000 (+7.1%); Los Angeles, $629,000 (+5.7%); Seattle, $503,000 (+5.1%); Boston, $491,000 (+5.9%); Denver, $450,000 (+7.7%); New York-Newark-Jersey City, $428,000 (+2.8%); Washington-Arlington-Alexandria, $426,000 (+4.3%); and Portland OR, $399,000 (+2.5%).
(4) Currently, the dozen U.S. metropolitan statistical areas (MSAs) with the fastest year-over-year increases in employment are: Orlando, +5.9%; Jacksonville, +4.4%; Houston, +4.3%; Miami, +4.2%; Austin, +3.9%; Phoenix and Tampa, +3.8%; Seattle, +3.7%; Las Vegas, +3.6%; Raleigh and San Jose, +3.3%; and Dallas-Ft. Worth, +3.0%. The first six cities are either in Florida or Texas. Florida is represented four times in the dozen; Texas, three times. Only San Antonio among the big cities in Texas failed to make the cut. Orlando at the top of the list, with its well-known theme parks, isn’t just an entertainment capital. It’s also a bedroom community for the burgeoning private sector space exploration efforts underway along Florida’s nearby Atlantic coastline. The total number of jobs in the U.S. is presently +1.7% compared with October 2017.
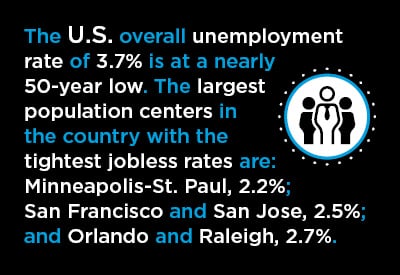
(5) The U.S. overall unemployment rate of 3.7% is at a nearly 50-year low. The largest population centers in the country with the tightest jobless rates are: Minneapolis-St. Paul, 2.2%; San Francisco and San Jose, 2.5%; Orlando and Raleigh, 2.7%; and Jacksonville, Kansas City and Oklahoma City, 2.8%. The unemployment rate in Washington D.C. is 3.3% and in New York, 3.9%. Those two centers are being mentioned because it’s just been announced that Amazon’s much ballyhooed HQ2 project (i.e., it’s second headquarters, reaching out beyond Seattle) will be split between Long Island City, in the Queen’s borough of N.Y., and Crystal City, in Arlington, Virginia (on the outskirts of Washington). Each location may be the recipient of 25,000 extra jobs. There was also a consolation prize winner in Amazon’s HQ2 contest. With a gift of 5,000 jobs, Nashville will become home to an ‘Operations Center of Excellence’
(6) According to CBRE’s latest study, cities in the East (9.6%) and West (11.1%) currently have the lowest office vacancy rates in the country. The South (15.7%) and Midwest (15.0%) still have room for improvement. (Low vacancy rates imply a need for more square footage construction.) The urban centers across the nation with the lowest office vacancy rates are: San Francisco, 5.2%; Midtown-South Manhattan, 6.2%; Oakland, 6.4%; Boston, 6.9%; Midtown Manhattan, 7.0%; Austin, 7.2%; Charlotte, 7.3%; Seattle, 8.2%; and Nashville, 9.1%. Many of the foregoing are high-tech hubs. As digital data management and software development continue to flourish, research and processing staffs will require expanding office space.
(7) In Canada’s office markets, according to Altus Group, the ranking of cities by vacancy rates is: Vancouver, 6.8%; Winnipeg, 7.5%; Toronto, 8.6%; Ottawa, 10.2%; Edmonton, 12.6%; Montreal, 13.7%; Halifax, 15.8%; and Calgary, 22.8%. Relative weakness in energy prices since mid-2014 has cut a swath through the payrolls of head offices in Calgary’s core. There are two trends in office leasing worthy of mention. First is an increasing tendency to share space. In effect, the Airbnb concept to help find temporary living quarters is now being applied to commercial space. Also, many tenants, with an emphasis on startups in the high-tech sector, have become less willing to sign long-term rental agreements. They want more flexibility.
(8) It’s no coincidence that many of the cities already mentioned in this Nuggets report for having low unemployment rates or rapid jobs buildups are also recording impressive gains in new home construction. Strong year-over-year increases in residential building permits are occurring in: Orlando, +44%; Charlotte, +31%; Minneapolis-St. Paul, +29%; Raleigh and Houston, +23%; Austin and Phoenix, +19%; and Jacksonville, +14%. San Diego, +25%, and Salt Lake City, +16%, are also stepping forward boldly on the U.S. new homes front.
(9) The confidence of American consumers is extraordinarily upbeat. The Conference Board’s Consumer Confidence Index (CCI) in October soared to 137.9 from 135.3 in September. The CCI is now at its best level since September 2000’s 142.5. Over time, the index fluctuates above and below a 1985 base of 100.0. In 1985, confidence was on an even keel, neither too over-the-top nor too under-the-weather. In October, the Purchasing Managers’ Index (PMI) of the Institute for Supply Management (ISM) was 57.7%. According to the ISM, historical data links a PMI reading of 57.7% with an annualized ‘real’ (i.e., adjusted for inflation) GDP growth rate of +4.5%.
(10) The current ranking of Canada’s six most populous cities according to unemployment rates, lowest to highest, is: Vancouver, 4.3%; Ottawa-Gatineau, 4.6%; Montreal, 5.9%; Edmonton and Toronto, 6.3%; and Calgary, 8.2%. The national jobless rate is 5.8%. The ranking of those same six cities by year-over-year jobs growth, fastest to slowest, is: Edmonton, +3.2%; Ottawa-Gatineau, +2.6%; Vancouver, +1.9%; Montreal, +1.2%; and Calgary and Toronto, +0.6%. The total jobs count in Canada is +1.1% y/y. As for housing starts y/y, the order is: Ottawa-Gatineau, +9%; Toronto, +4%; Calgary, +3%; Montreal, +2%; Vancouver, -7%; and Edmonton, -14%. The make-up of residential groundbreakings in Canada so far this year has been far more heavily weighted towards multi-unit structures (72% of total units) than single-family homes (28%).


Recent Comments
comments for this post are closed