
The latest Employment Situation report from the Bureau of Labor Statistics (BLS) records that the U.S. construction sector’s unemployment rate in October was 3.6%, lower than the national ‘headline’ rate of 3.7% for all jobs in the economy.

Since 3.7% as the national jobless level was a nearly 50-year low, for construction to have done even better was an outstanding achievement.
Also, for October 2018, the BLS calculated that construction workers’ year-over-year (y/y) wage gains were ‘richer’ than for all jobs (i.e., not just construction, but manufacturing and all manner of services work), both hourly (+4.2% versus +3.2%) and weekly (+4.5% versus +3.2%).
Why has construction performed so well in terms of minimal unemployment rate and rapid compensation gains? Because, in state after state, ‘hard hat’ jobs have increased super-quickly.
Maps 1 and 2 showcase construction’s extraordinary jobs growth. Map 1, through the means of green shading, lays out all the states where the y/y percentage change in the number of construction jobs is greater than the national ‘all-jobs’ climb of +1.7%.
The green shading progresses from lighter to darker based on how much faster there have been increases in construction jobs as opposed to ‘all jobs’ (see legend).
For the six states with the darkest green shading – i.e., Georgia (+11.5%); Arizona (+11.4%); Nevada (+11.1%); New Hampshire (also +11.1%); Oregon (+9.9%); and Florida (+9.8%) – the improvements in number of construction jobs have all been +9.0% y/y or greater.
Remarkably, 40 out of a possible 52 jurisdictions (i.e., 50 states, plus D.C. and Puerto Rico) have green shading.
Map 1: U.S. State Construction Employment, Oct. 2018 vs Oct. 2017
(greater than the U.S. ‘headline’ rate of +1.7% for all type-of-industry jobs)
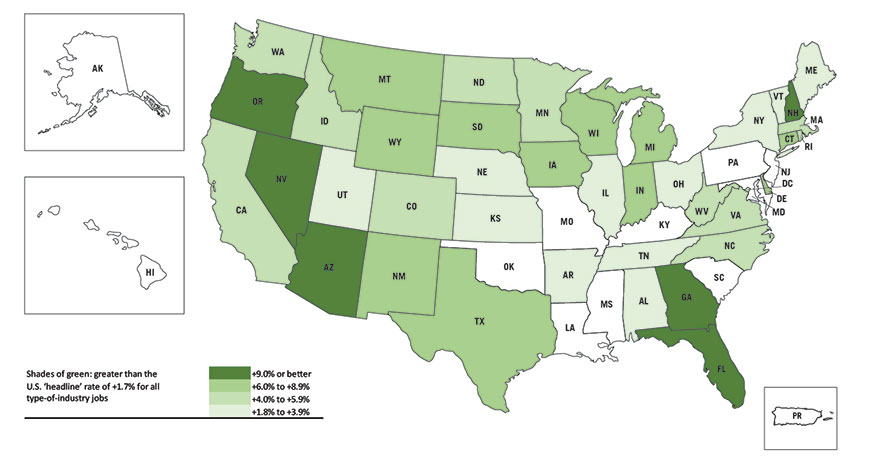
Data source: Bureau of Labor Statistics (BLS).
Graphic: ConstructConnect.
Map 2 highlights the mere dozen instances where the construction jobs change has trailed the all-jobs pickup. The shading moves from lighter blue to darker blue, depending on the degree of weakness in construction jobs growth (again, see legend).
The two darkest shades of blue are reserved for the five jurisdictions with y/y declines in construction employment – New Jersey (-4.3%); Puerto Rico (-1.5%); Kentucky (-1.0%); South Carolina (-0.7%); and Mississippi (-0.2%).
As an interesting sidebar, three of the 12 blue-shaded states or jurisdictions are geographic outliers and their citizens must feel as though they’ve recently been snake-bitten.
Puerto Rico is still recovering from hurricane damage; Hawaii has suffered through volcanic eruption; and Anchorage, Alaska has just been rocked by an earthquake.
Map 2: U.S. State Construction Employment, Oct. 2018 vs Oct. 2017
(equal to or less than the U.S. ‘headline’ rate of +1.7% for all type-of-industry jobs)
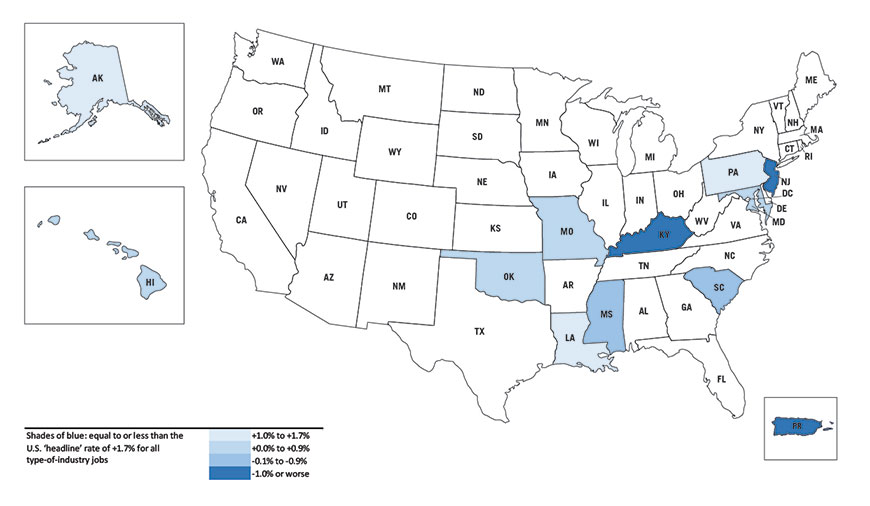
Data source: Bureau of Labor Statistics (BLS).
Graphic: ConstructConnect.


Recent Comments