U.S. Inflation Holds at +2.0%
In the movie about the economy, inflation does not always play the villain. In fact, a certain small degree of advance in a nation’s general price level is considered optimal. It allows businesses to raise prices, compensate workers more and repay fixed debt faster.
Consensus holds that the best-case rate of price increase is approximately +2.0% year-over-year for the Consumer Price Index (CPI).
The top half of Graph 1 sets out, for all months since January 2001, the year-over-year change of CPI-U. CPI-U is the consumer price index for all urban consumers, based on an average of U.S. cities. In the latest month, April 2019, CPI-U was +2.0% y/y, or exactly on target.
The bottom half of Graph 1 shows each month’s ‘actual’ year-over-year CPI-U differences from +2.0%. The light shaded areas, underneath the horizontal 0.0% line, occurred when ‘actual’ inflation rates were less than +2.0%. The darkly shaded areas above the zero percent gridline highlight ‘actual’ inflation rates, year-over-year, that were greater than +2.0%.
The dark shaded areas of positive variation versus +2.0% have been few and far between over the past ten years. Moreover, only in 2011, did ‘actual’ inflation exceed ‘target’ inflation by more than one percentage point. From early 2012 to the present, volatility in ‘actual’ inflation has never stretched beyond an additional 1.0%.
In summary, U.S. inflation has turned off the lights, left a key with the neighbor, and gone on extended leave.
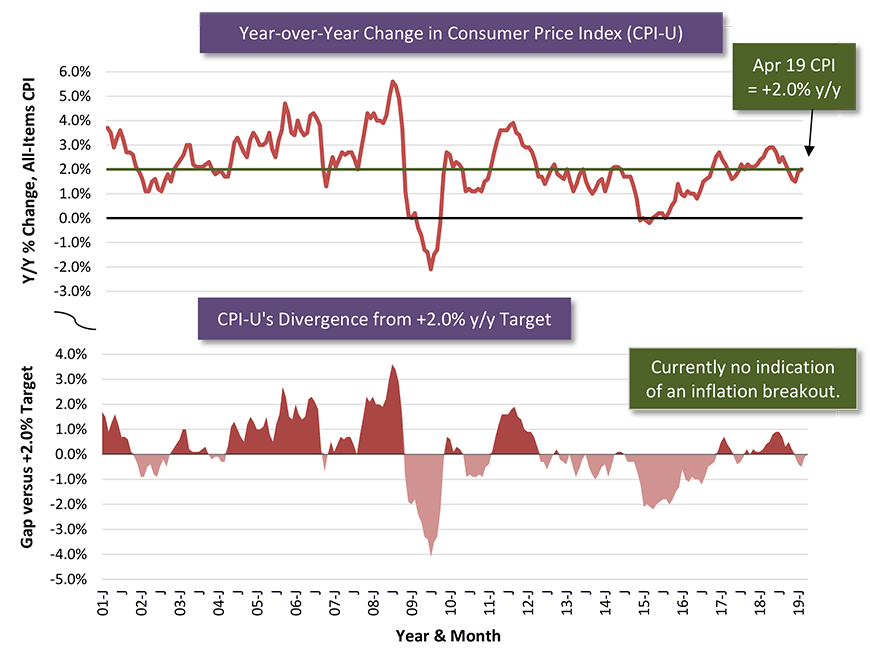
CPI-U is for ‘All Urban Consumers, U.S. City Average’. For a variety of reasons, there is a desirable rate of inflation and it is around +2.0% y/y. Latest data points are for April 2019.
Chart: ConstructConnect.
Inflation in Canada also at Optimal +2.0%
Graph 2 for Canada adopts the same format as Graph 1 for the U.S. ‘Actual’ year-over-year CPI performances for every month since January 2001 are plotted in the upper portion. The gaps between ‘actuals’ and +2.0% are laid out and emphasized by shading in the lower portion.
The darker shading above the 0.0% gridline in the bottom section of Graph 2 highlights when ‘actual’ inflation exceeded the +2.0% y/y target.
As in the U.S., there have been a minimal number of instances over the past decade when Canadian inflation has soared beyond what is considered acceptable. There were a few months in 2011 when Canada’s y/y CPI broke out and traveled beyond the additional 1.0% boundary − i.e., to reach more than +3.0% y/y. Not since then, however, has ‘actual’ Canadian inflation moved beyond +2.0% by more than one percentage point.
Copying the U.S. once again, Canada’s latest inflation rate, for April 2019, was precisely on target at +2.0% y/y. Until early in 2019, the central banks of both the U.S. and Canada appeared intent on continuing to pursue programs of interest rate hikes. Now, the path ahead has become less certain.
Presently, there is no justification for rate increases based on price movements. Perhaps, if the trade war with China heats up further and more tariffs are imposed, import ‘ticker’ shock may lead to more worry.
What seems more likely, however, is that a deepening of the trade war would slow gross domestic product (GDP). In such a circumstance, President Trump might get his wish for lower interest rates as a measure to stimulate the economy.
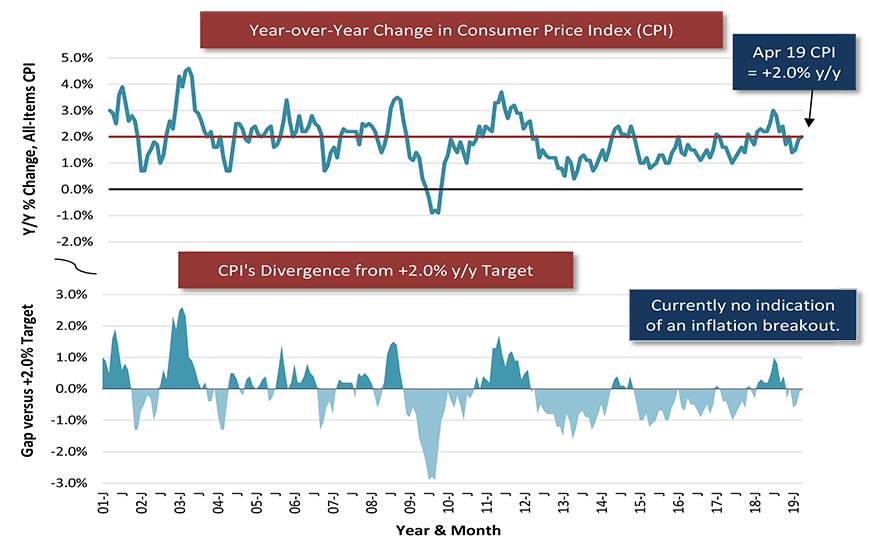
For a variety of reasons, there is a desirable rate of inflation and it’s around +2.0% y/y.
Latest data points are for April 2019.
Chart: ConstructConnect.
Chart: ConstructConnect.
Key Price Inflation Comparisons, U.S. and Canada
Graph 3 features year-over-year CPI results not only for the U.S. versus Canada, but also for the latest month compared with the prior month. Currently, for ‘all-items’ and ‘core’ inflation (which leaves out mainly food and energy items that often display extreme price volatility), the U.S. and Canada have been recording almost identical y/y patterns. The four colored bars, for April 2019, in the top two-thirds of Graph 3 are all either +2.0% or +2.1%. (The four gray-shaded bars for the previous month, March 2019, are either +1.9% or +2.0%.)
In the lower third of the graph, April’s year-over-year price of gasoline fell in Canada (-1.6%), while it rose in the U.S. (+3.1%). On a month-to-month basis, April’s price of gasoline in the U.S. shot up by +10.3%. Say good-bye to bargain-priced petrol.
Year-over-year dramatic price movements, on the upside, in the U.S. in April 2019 included the following: health insurance, +10.7%; admission to sporting events, +7.8%; baby food, +6.0%; postage, +5.9%; major appliances, +5.6%; and motor vehicle maintenance and servicing, +4.5%.
On the downside were: televisions, -18.8%; eggs, -16.4%; telephone hardware, -14.4%; women’s dresses, -11.0%; toys, -9.8%; and computer software, -7.9%.
Turning to north of the border, Canada in April saw a +10.2% y/y spike in the price of natural gas, brought on by the introduction of new carbon charges in several provinces.
Regionally, all four western provinces recorded y/y CPI climbs that surpassed the +2.0% national average: B.C., +2.7%; Manitoba and Saskatchewan, each +2.3%; and Alberta, +2.2%. In the other six provinces, inflation ranged from +1.2% for P.E.I. to +1.9% in Ontario.
Current Month & Previous Month, (April & March 2019)
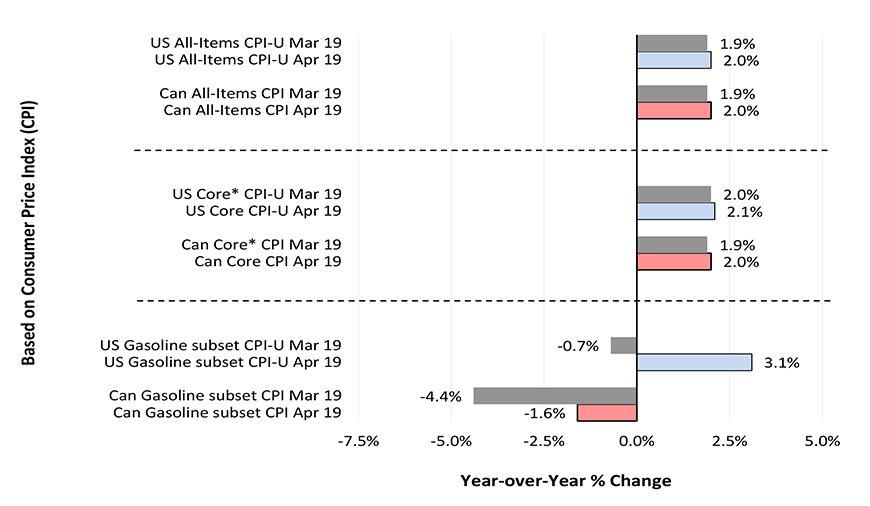
Chart: ConstructConnect.



Recent Comments