Q2 GDP Growth Matches Long-term Annual Average
U.S. ‘real’ (i.e., adjusted for inflation) gross domestic product (GDP) growth in Q2 was +2.1% according to the ‘advance estimate’ published by the Bureau of Economic Analysis (BEA). The latest quarter-to-quarter change, annualized, was an easing from Q1’s pace of +3.1%.

The +2.1% figure matches the average annual growth rate for the U.S. economy over the past 19 years, from 2000 to 2018. Leaving out the two recession years, 2008 and 2009, average annual U.S. GDP growth has been +2.5%. From 2010 through 2018 ‒ in other words, since the recession ‒ average annual GDP growth in America has been +2.3%.
In the second quarter of this year, the strongest advances among GDP components occurred in consumer spending (+4.3% q/q annualized) and government spending (+5.0%). Consumers spent heavily on durable goods (+12.9%). Government spending was strongest at the federal level (+7.9%).
Displaying weakness among GDP line items were nonresidential structures (-10.6%), residential investment (-1.5%) and foreign trade. Exports of goods and services declined (-5.0%) while imports stayed flat (+0.1%).
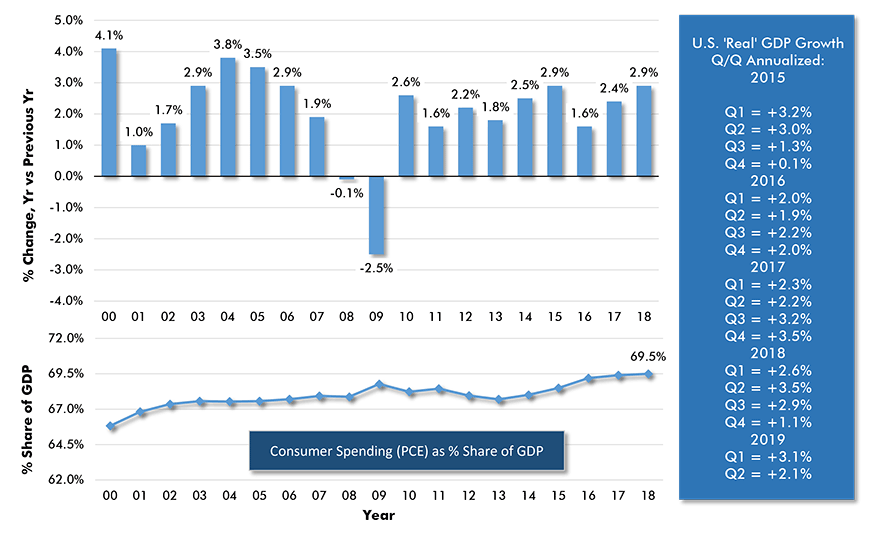
Chart: ConstructConnect.
First Fault Line ‒ Foreign Trade
The latest detailed numbers on U.S. foreign trade run through May. Graph 2 shows that, despite concerted efforts by Washington to block imports, especially through the imposition of tariffs on Chinese goods, there’s been no progress in reducing the enormous size of the U.S. trade deficit.
May’s goods and services trading shortfall was two-thirds of a trillion dollars (-$666 billion USD). It was saved from being a lot worse by a quarter-of-a-trillion-dollars ‘services’ trade surplus (+$247 billion USD). The ‘goods’ trade deficit, which includes high-profile manufactured products and natural resource items, was -$913 billion. That’s not far away from a negative-trillion-dollars.
From Graph 3, the new tariff regime has reduced China’s share of the U.S. goods trade deficit from nearly half to less than 40%. But other countries, especially Mexico and nations in the Euro area, have been stepping in as alternative suppliers of imports that have become less available from China.
Graph 2: United States’ Foreign Trade: Goods and Services Balance − May 2019
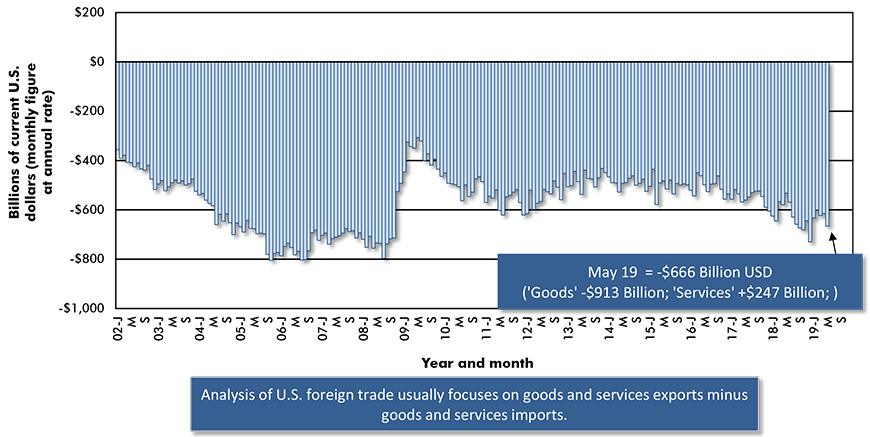
The last data point is for May 2019.
Based on seasonally adjusted monthly figures, projected at an annual rate.
Data source: Bureau of Economic Analysis (BEA).
Chart: ConstructConnect.
Graph 3: Geographic Sources of Total U.S. Foreign Trade Deficit in Goods − May 2019
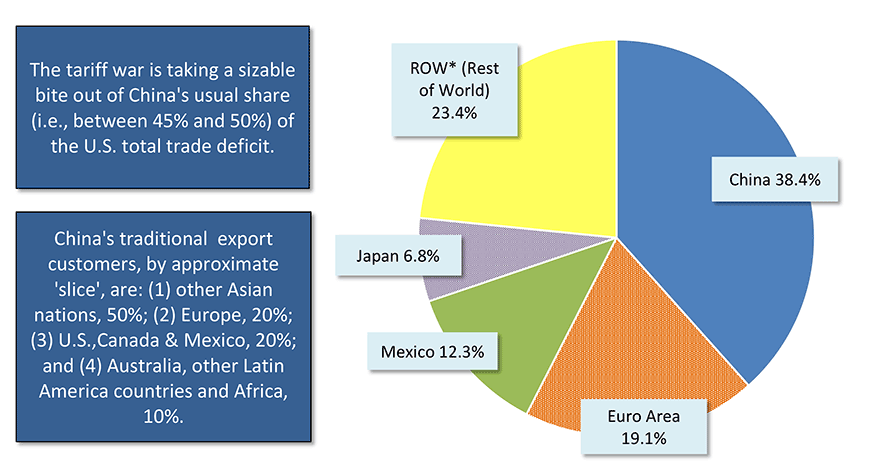
*Major contributors to ROW deficit are South Korea, Taiwan, India and Malaysia.
Data source: U.S. Census Bueau and Bureau of Economic Analysis (BEA).
Chart: ConstructConnect.
Second Fault Line – Housing Starts Lose Traction
U.S. housing starts through the first half of the current year are -3.9% compared with the same January-to-June period of 2018. Single-family groundbreakings, in units, are -4.4% and multi-family initiations are -3.0%.
Regionally, only the South has recorded a gain in new home starts so far in 2019, +5.0%. Elsewhere in the country, the decline has been modest in the Northeast, -5.4%; more significant in the Midwest, -9.3%; and severe in the West, -16.4%.
Due to its large weighting in total starts, the South’s positive performances provides extraordinary support for the national level. Approximately half of all new home groundbreakings in the U.S. occur in the South Region.
The residential building permits data series provides advance indication of how home starts will behave with a one-to-three-months lag. As Graph 5 highlights, however, recently there has been no encouragement on the homebuilding front to be taken from the permit numbers.
The monthly nation-wide residential building permits figure has been lodged around 1.3 million units annualized for the past two-and-a-half years. Moreover, in the last couple of months, it has dropped closer to 1.2 million units.
Graph 4: U.S. Housing Starts
Jan-Jun 2019 vs Jan-Jun 2018 % Changes
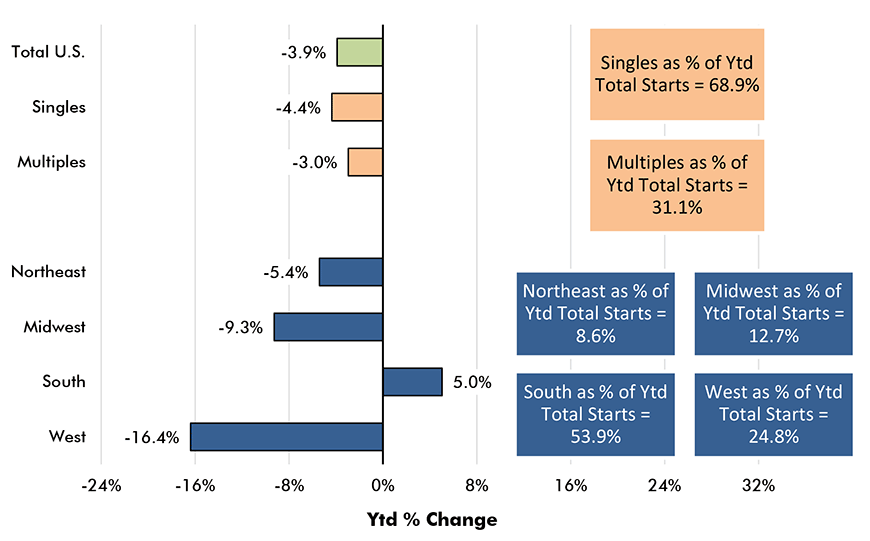
Based on averages of monthly seasonally adjusted and annualized (SAAR) unit starts.
Data source: U.S. Census Bureau.
Chart: ConstructConnect.
Graph 5: U.S. Monthly Residential Building Permits
(seasonally adjusted at annual rates – SAAR)
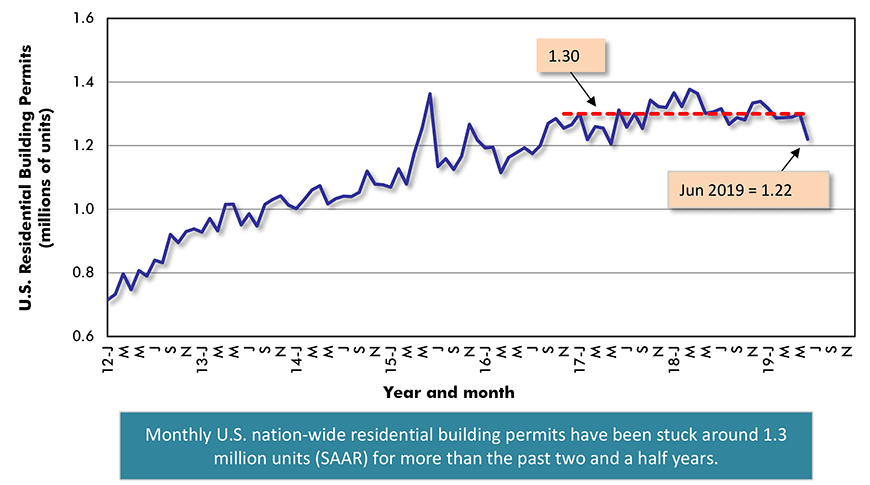
The last data points are for June, 2019.
Data source: U.S. Census Bureau (Department of Commerce).
Chart: ConstructConnect.
Third Fault Line – Home-related Consumer Spending Turns Weak
Supported by continuing healthy jobs creation and decent earnings increases, consumer expenditures in the latest GDP results were a bullish +4.3% quarter to quarter annualized.
Confirmation of confident consumer spending activity can also be found in the latest retail sales numbers. Graph 6 shows which shopkeepers are doing best on a year-over-year percentage-change basis. Total U.S. retail sales are presently +3.3%. They’re +3.9% if the sales of gasoline stations are left out of the equation. Gas station receipts have been adversely affected by a year-over-year decline (-5.4%) in the price of petrol.
For construction firms, though, there are some concerning trends. For starters, there’s the huge increase in sales being rung up by non-store retailers, +13.4% y/y. Web-based platforms and electronic auctions are demanding much of the attention in the retail sphere. They don’t generate additional square-footage demand to the same degree as new ‘bricks and mortar’ locations. There are partial offsets, however, in the building of large distribution and warehouse facilities.
For contractors waylaid by the inertia in homebuilding, verification of a wider economic impact will be found in the poor showing of retail sales that are specifically home-related.
Graph 7 tracks the retail sales of materials utilized in new home construction and renovations, plus sales of the key ingredients that turn the shell of an accommodation into a ‘cocoon’. Personalizing a home takes purchases of furniture and furnishings and electronics and appliances.
For the first time since the 2008-09 recession, all three of the aforementioned ‘home-related’ retail sales data series have fallen below zero on a y/y basis.
Graph 6: U.S. Retail Sales, Year over Year (Y/Y) − June 2019
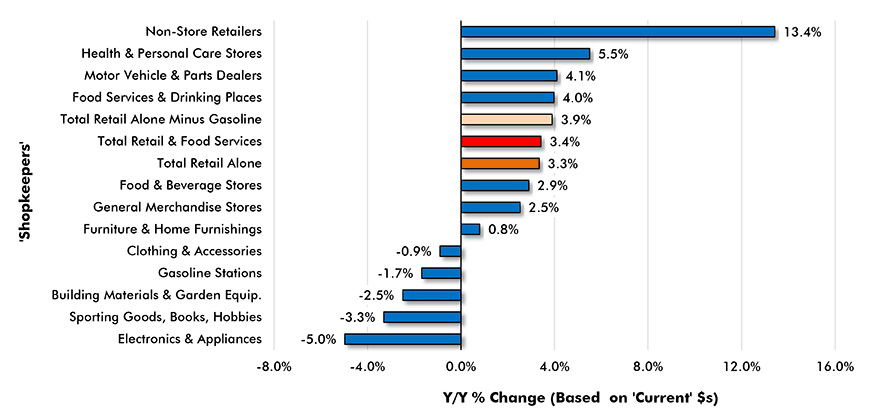
”Current’ dollars means not adjusted for inflation.
Data source: U.S. Census Bueau.
Chart: ConstructConnect.
Graph 7: U.S. Home-Related Retail Sales − Three Months Smoothed
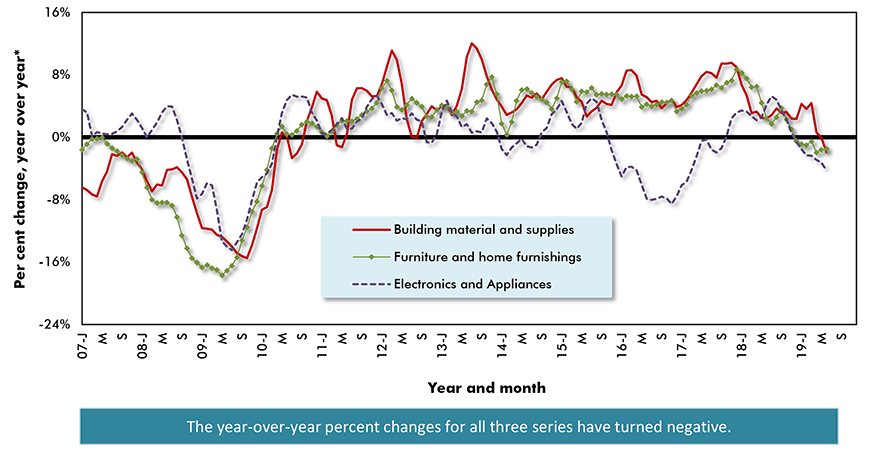
*"Year over year" is each month versus the same month of the previous year.
Based on three-month moving averages of current dollar adjusted data. Latest data points are for June 2019.
Adjustments are for seasonal variation, holiday and trading day differences, but not for price changes.
Data source: U.S. Census Bueau (Department of Commerce).
Chart: ConstructConnect.


Recent Comments