Strong U.S. Jobs Growth has Interest Rate Implications
The U.S. total number of jobs in June shot up by +224,000, according to the latest Employment Situation report from the Bureau of Labor Statistics (BLS). A slight rise in the ‘participation rate’, to 62.9% from 62.8% in May, caused June’s unemployment rate to climb a notch, from 3.6% to 3.7%. A 3.7% level of unemployment is still remarkably tight.

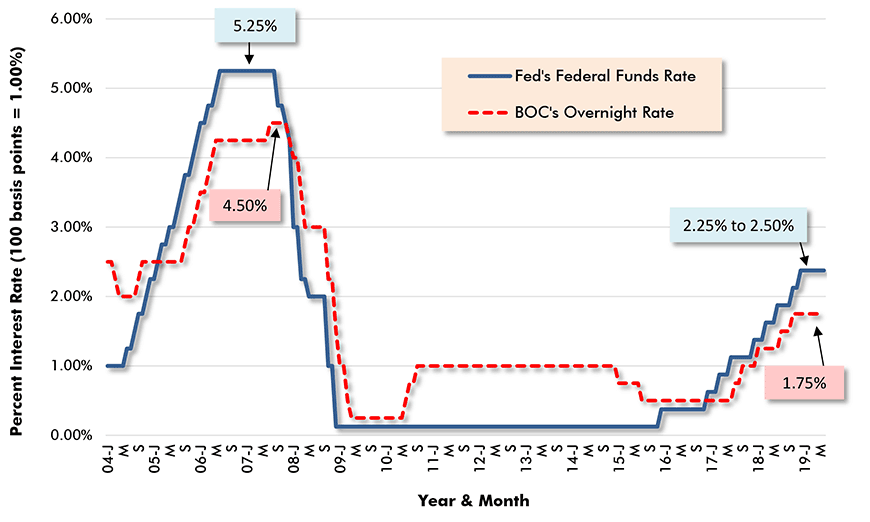
Everyone’s keeping a close eye out for signs of a weakening U.S. economy that would warrant an interest rate cut by the Federal Reserve (Graph 1). They won’t find justification for such a move in June’s jobs numbers. May’s lackluster +75,000 addition had pointed to trouble possibly brewing, but that’s become old news. It’s been superseded by fresh buoyancy.
It should be pointed out, however, that the jobs performances in some sectors have taken an interesting turn of late. This will be examined in the next section.
Worth noting, also, is that despite June’s strength, average monthly job creation in the U.S. so far in 2019 has been +172,000. With half a year having already sped by, +172,000 is a decline of more than a quarter (-26.8%) compared with January-to-June 2018’s average of +235,000.
Furthermore, U.S. total jobs year over year (i.e., 12 months) are now +2.301 million, while year-to-date (i.e., six months) they are 1.033 million. Note that the six-month figure is less than half of the 12-month figure. Apparently, ‘full throttle’ hiring has been eased back a bit.
Graph 1: Central Bank Key Policy-Setting Interest Rates −
Federal Reserve’s Federal Funds Rate & Bank of Canada’s Overnight Rate

Chart: ConstructConnect.
Construction Made 10% Contribution to Total Hiring
Construction (+21,000) made a 10% contribution to June’s total U.S. jobs growth number of +224,000. But construction’s monthly average staffing increase through the first half of 2019, at +18,000, has been down significantly (-43.5%) compared with January-to-June 2018’s monthly average of +32,000.
Manufacturing recorded a small bump in payrolls in June, at +17,000, but the sector’s monthly average rise of +7,000 in 2019 year to date also does not compare well with last year’s first half average of +24,000.
The sector with the biggest jump in employment in June was ‘health care and social assistance’, +51,000 jobs. Health care was +35,000, and social assistance, +16,000. Within health care, the largest gains were in ‘ambulatory health care’ (e.g., medical clinics and home health care services), +19,000, and hospitals, +11,000.
‘Professional and business services’ jobs in June were +51,000, and government payrolls were +33,000. The hiring by the public sector was almost entirely at the local level (+29,000), as the states (+2,000) and Washington (also +2,000) stayed quiet.
In four industrial sub-sectors, employment was essentially stagnant: leisure and hospitality, +8,000; financial activities, +2,000; information services, also +2,000, and retail, -6,000.
U.S. Wage Gains Tepid
U.S. wage gains were once again tepid in the latest month. For all jobs in the economy, including bosses, year-over-year average hourly and weekly earnings were +3.1% and +2.8% respectively. Construction workers, as a subset, were compensated a bit more ‘richly’, +3.2% hourly and +3.4% weekly. Leaving out supervisory personnel, the hourly and weekly y/y increases economy-wide were +3.4% and +2.7%, with construction workers at +3.3% and +3.0%.
Graph 2 shows three-month moving-average y/y compensation changes for ‘production and non-supervisory’ personnel (i.e., omitting bosses) for ‘all jobs’ and for construction. Lately, the curves have been demonstrating a tendency to trend downwards.
Graph 2: Average Weekly Earnings Y/Y – ‘All Jobs’ and Construction

Chart: ConstructConnect.
Canada’s 1st Half Jobs Creation Warrants Kudos
North of the border, as reported by Statistics Canada, the total jobs change in June was a disappointing -2,000 and the unemployment rate retreated to 5.5% from May’s 5.4%. Nevertheless, monthly average jobs creation in the first half of this year was a commendable +41,000 thanks to outsized increases in January (+67,000), February (+57,000) and especially April (+106,000).
Also, employment decreases in manufacturing (-15,000) and construction (-8,000) in June obscured the fact that Canadian services employment (+31,000) shot up nicely in the latest month.
Versus a year ago, there are now +421,000 more jobs in Canada, with +248,000 of them arising since the beginning of this year. Canada’s good performance on the jobs front deserves more recognition.
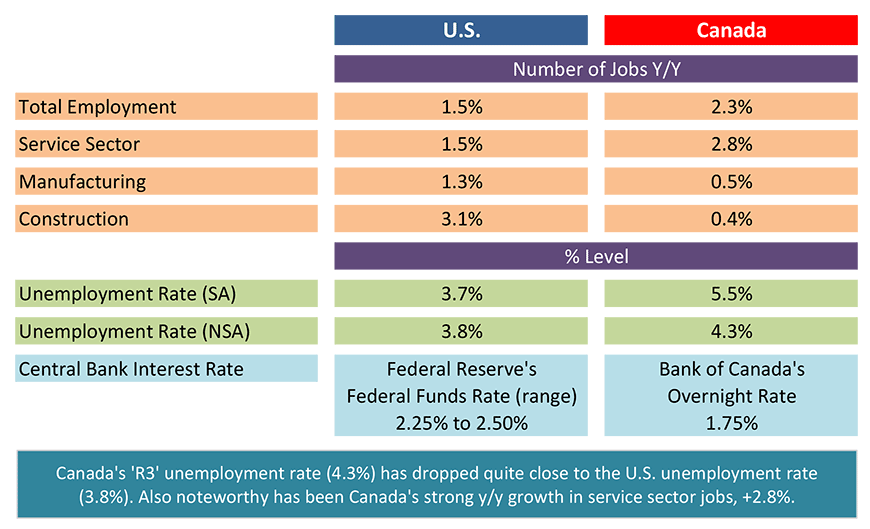
With respect to total employment, Canada is currently +2.3% y/y while the U.S. is +1.5%. In services jobs, Canada is +2.8% y/y to America’s +1.7%. Where Canada is falling behind, though is in manufacturing and construction jobs. In the former, it’s the U.S. +1.3% and Canada +0.5%. In the latter, the U.S. has the advantage, +3.1% to +0.4%.
Provincially, the lowest unemployment rates in June were recorded in British Columbia, 4.5%, and Quebec, 4.9%. As for year-over-year employment in the latest month, B.C. was again out front, at +4.4%, with Nova Scotia in second spot, +3.4%.
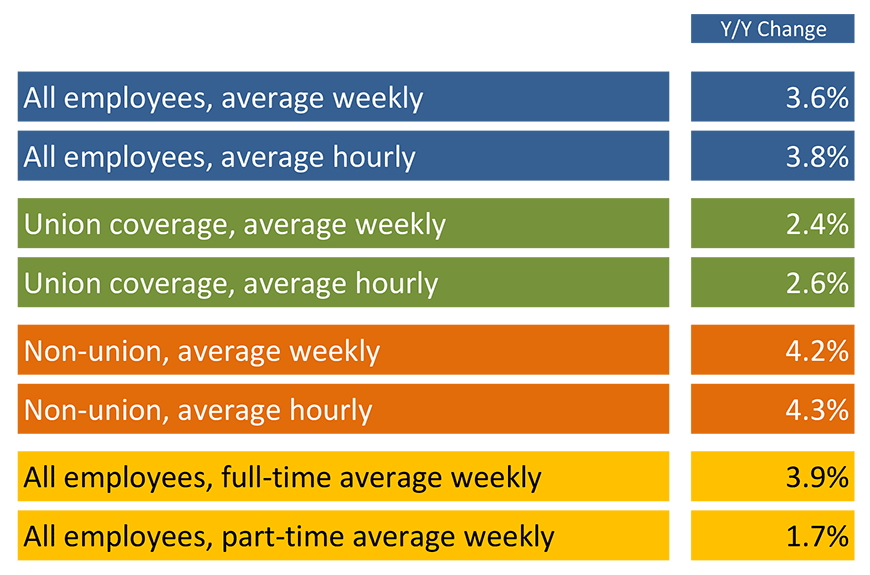
Table 1: Canadian Workforce Earnings,
Year over Year – June 2019

(‘Current’ means no scaling back due to inflation.)
Chart: ConstructConnect.
Table 2: U.S. and Canadian Jobs Markets – June 2019

U.S. labor data is from a ‘payroll survey’ / Canadian labour data is from a ‘household survey’.
Canadian NSA unemployment rate ‘R3’ is adjusted to U.S. concepts (i.e., it adopts U.S. equivalent methodology).
Table: ConstructConnect.


Recent Comments
comments for this post are closed