In 2018, the value of total U.S. new construction was just under $1.3 trillion. ConstructConnect is forecasting the figure to rise to $1.45 trillion by 2021. The annual average growth rate for total U.S. construction from 2010 to 2018 was +4.2% (see earlier article entitled, “U.S. Construction Spending Hits a Soft Spot”).
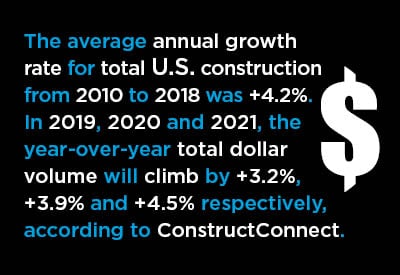
2018’s increase versus 2017 was +3.9%. In 2019, 2020 and 2021, the year-over-year total dollar volume will climb by +3.2%, +3.9% and +4.5% respectively, according to ConstructConnect.
The construction investment figures are put-in-place (PIP) statistics calculated and published by the Census Bureau. They are analogous to work-in-process or progress payments as projects proceed. For example, a $60 million office tower will see PIP spending spread out over several years. There’s an element of ‘smoothing’ in the PIP data series.
PIP numbers lag ConstructConnect’s up-front ‘starts’ statistics. The ‘starts’ numbers are built up from estimated lump-sum values for projects, entered into the data base in the month when ground is broken. The more volatile starts numbers set the stage for later PIP numbers.
Table 1 records ConstructConnect’s PIP forecasts for the full array of type-of-structure categories.
Click here to download the Summer 2019 U.S. Put-in-place Construction Forecasts PDF.
Table 1: U.S. Construction Spending (put-in-place investment)
(billions of “current” $s)
| Type of Construction: | 2014 | 2015 | 2016 | 2017 | 2018 | 2019 | 2020 | 2021 |
| Grand Total | 1005.6 | 1113.6 | 1191.8 | 1246.0 | 1294.0 | 1335.2 | 1387.1 | 1449.2 |
| (year versus previous year) | 10.7% | 7.0% | 4.5% | 3.9% | 3.2% | 3.9% | 4.5% | |
| Total Residential | 374.9 | 428.8 | 473.9 | 531.7 | 546.2 | 534.2 | 545.9 | 569.9 |
| 14.4% | 10.5% | 12.2% | 2.7% | -2.2% | 2.2% | 4.4% | ||
| Total Nonresidential | 630.8 | 684.9 | 717.9 | 714.3 | 747.8 | 801.0 | 841.2 | 879.3 |
| 8.6% | 4.8% | -0.5% | 4.7% | 7.1% | 5.0% | 4.5% | ||
| Total Commercial/for Lease | 126.2 | 143.3 | 172.7 | 183.3 | 194.3 | 200.6 | 205.9 | 210.2 |
| 13.6% | 20.5% | 6.1% | 6.0% | 3.2% | 2.6% | 2.1% | ||
| Lodging | 16.7 | 21.9 | 27.0 | 28.7 | 31.9 | 32.9 | 32.7 | 31.1 |
| 30.9% | 23.1% | 6.3% | 11.3% | 3.2% | -0.8% | -4.8% | ||
| Office | 46.6 | 55.5 | 67.6 | 66.9 | 72.9 | 78.7 | 82.5 | 85.3 |
| 19.2% | 21.8% | -1.1% | 9.1% | 7.9% | 4.9% | 3.4% | ||
| Commercial/Retail | 62.8 | 65.9 | 78.2 | 87.7 | 89.5 | 89.0 | 90.7 | 93.8 |
| 4.9% | 18.6% | 12.3% | 2.0% | -0.6% | 1.9% | 3.4% | ||
| Total Institutional | 147.9 | 156.2 | 165.4 | 169.6 | 175.0 | 183.9 | 191.6 | 199.3 |
| 5.6% | 5.9% | 2.6% | 3.2% | 5.1% | 4.2% | 4.0% | ||
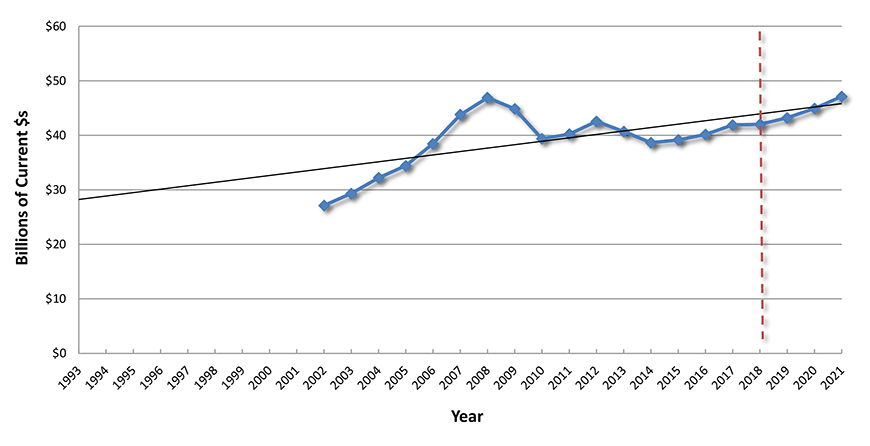
| Health Care | 38.6 | 39.1 | 40.2 | 41.9 | 42.0 | 43.2 | 44.9 | 47.1 |
| 1.3% | 2.6% | 4.4% | 0.2% | 2.9% | 3.9% | 4.9% | ||
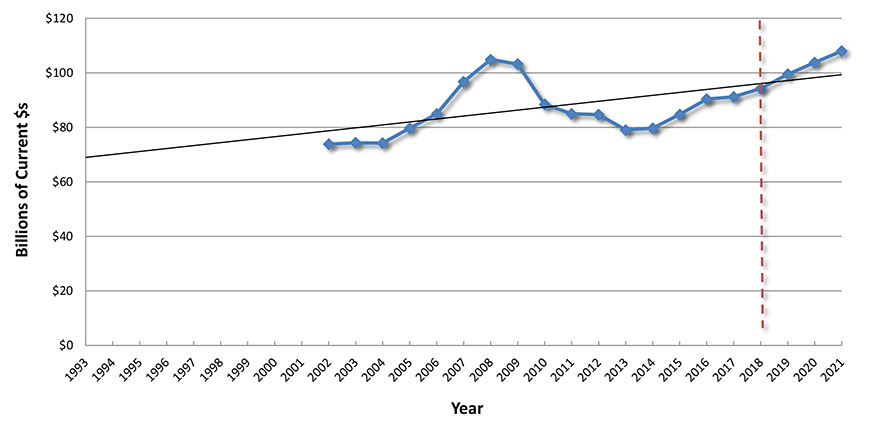
| Educational | 79.7 | 84.8 | 90.3 | 91.2 | 94.3 | 99.4 | 103.8 | 108.0 |
| 6.4% | 6.6% | 1.0% | 3.3% | 5.5% | 4.4% | 4.0% | ||
| Religious | 3.4 | 3.6 | 3.7 | 3.4 | 3.0 | 2.8 | 2.7 | 2.7 |
| 5.6% | 4.0% | -9.5% | -10.2% | -7.2% | -3.7% | -0.2% | ||
| Public Safety | 9.4 | 8.5 | 8.0 | 8.3 | 9.2 | 10.2 | 11.0 | 11.5 |
| -10.1% | -5.4% | 3.3% | 11.5% | 10.8% | 7.5% | 4.6% | ||
| Amusement and Recreation | 16.8 | 20.3 | 23.2 | 24.9 | 26.5 | 28.2 | 29.2 | 30.1 |
| 20.8% | 14.3% | 7.3% | 6.7% | 6.3% | 3.5% | 3.0% | ||
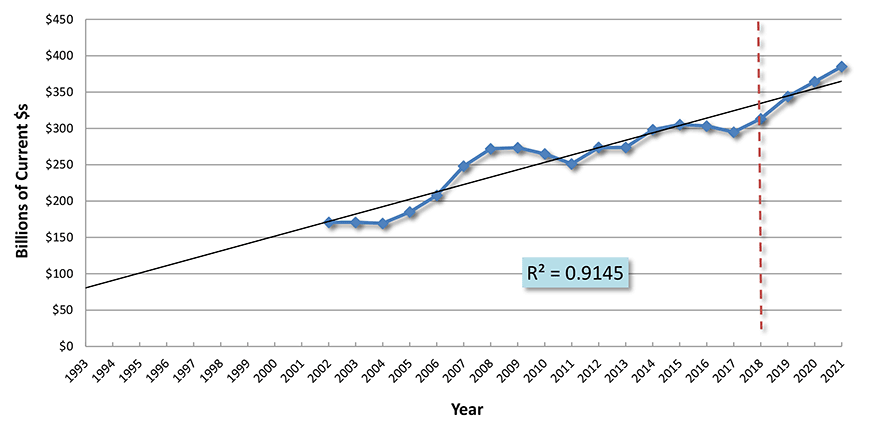
| Total Engineering/Civil | 298.0 | 305.4 | 303.4 | 295.0 | 313.3 | 343.8 | 364.3 | 385.0 |
| 2.5% | -0.7% | -2.8% | 6.2% | 9.7% | 6.0% | 5.7% | ||
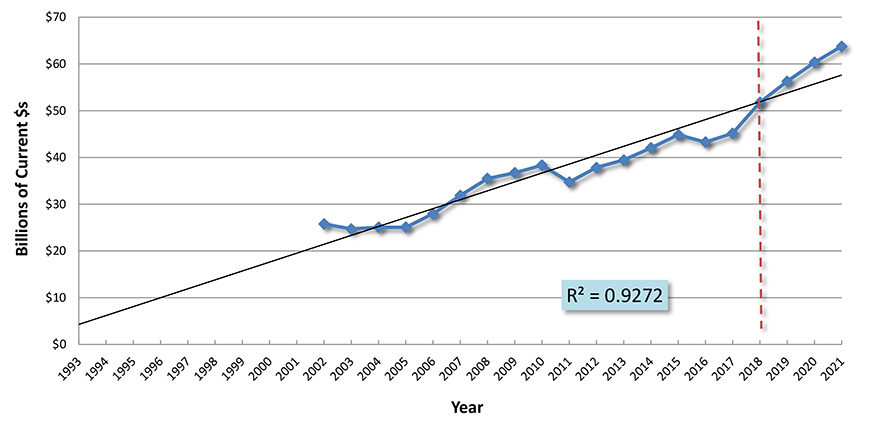
| Transportation | 42.0 | 44.8 | 43.3 | 45.2 | 51.8 | 56.3 | 60.3 | 63.8 |
| 6.7% | -3.5% | 4.4% | 14.6% | 8.7% | 7.2% | 5.7% | ||
| Communication | 17.3 | 21.7 | 22.2 | 24.8 | 24.6 | 23.3 | 23.0 | 23.8 |
| 25.4% | 2.2% | 12.0% | -0.8% | -5.6% | -1.1% | 3.4% | ||
| Power | 110.1 | 103.0 | 101.4 | 96.5 | 100.2 | 106.5 | 113.7 | 122.0 |
| -6.5% | -1.5% | -4.8% | 3.8% | 6.3% | 6.8% | 7.3% | ||
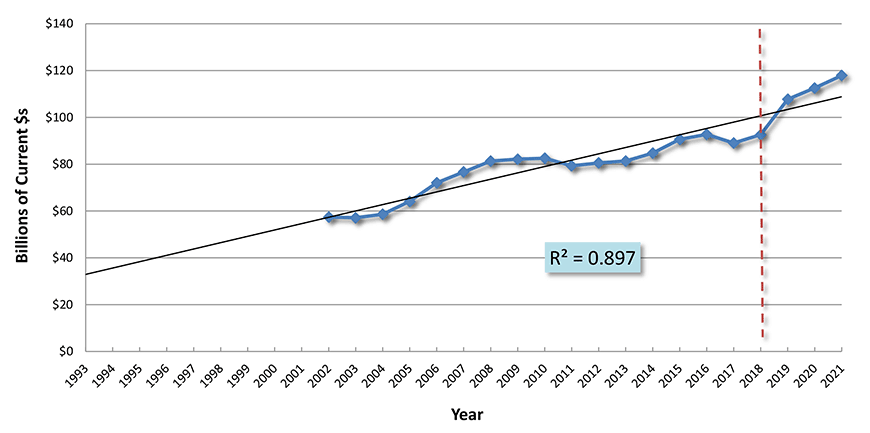
| Highway and Street | 84.7 | 90.6 | 92.7 | 89.1 | 92.6 | 107.7 | 112.6 | 117.9 |
| 6.9% | 2.3% | -4.0% | 4.0% | 16.3% | 4.5% | 4.7% | ||
| Sewage and Waste Disposal | 23.2 | 24.4 | 23.1 | 20.4 | 22.1 | 24.8 | 27.1 | 28.6 |
| 5.2% | -5.0% | -11.9% | 8.2% | 12.4% | 9.4% | 5.4% | ||
| Water Supply | 13.4 | 13.2 | 13.0 | 11.8 | 13.8 | 15.8 | 17.3 | 18.1 |
| -1.7% | -0.8% | -9.5% | 17.1% | 14.6% | 9.1% | 4.6% | ||
| Conservation and Development | 7.3 | 7.7 | 7.6 | 7.2 | 8.2 | 9.4 | 10.3 | 10.9 |
| 5.7% | -1.8% | -4.5% | 13.3% | 14.5% | 9.1% | 6.4% | ||
| Total Industrial/Manufacturing | 58.6 | 79.9 | 76.4 | 66.4 | 65.1 | 72.8 | 79.4 | 84.8 |
| 36.3% | -4.4% | -13.0% | -2.0% | 11.7% | 9.2% | 6.7% |
"Current" means not adjusted for inflation.
Data source: U.S. Census Bureau.
Table: ConstructConnect.
(put-in-place investment)
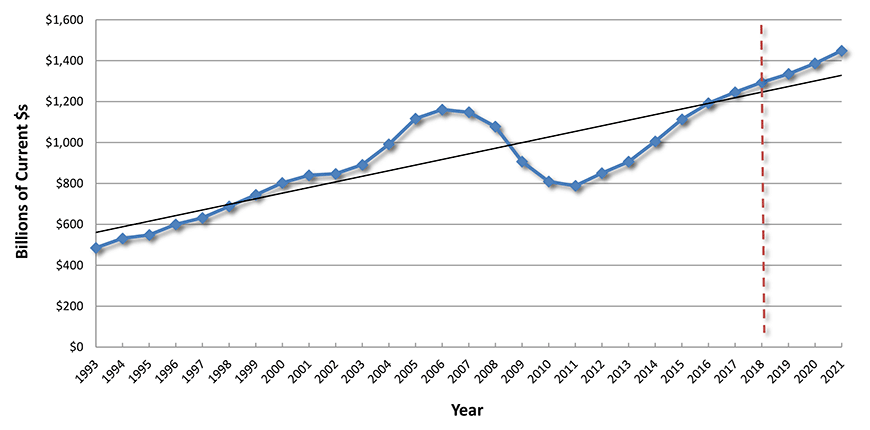
Chart: ConstructConnect
Residential Construction Outlook
From the end of the 2008-09 recession through 2018, residential construction’s annual average PIP increase was a rapid +8.7%. At the end of that time frame, however, capital spending eased off to +2.7% in 2018 versus 2017, after achieving +12.2% in 2017 over 2016.
Moving forward, there’s a plus for new home construction arising from millennial generation family formations. But at the same time, Washington’s seemingly less inviting stance on immigration will mute the role played by population growth in spurring on the need for new accommodations.
Should one or more Federal Reserve interest rate cuts occur this year, residential construction will be a prime beneficiary. Finally, the large renovation component of residential construction will continue to be aided by the economy’s strong record of jobs creation and income increases.
(put-in-place investment)
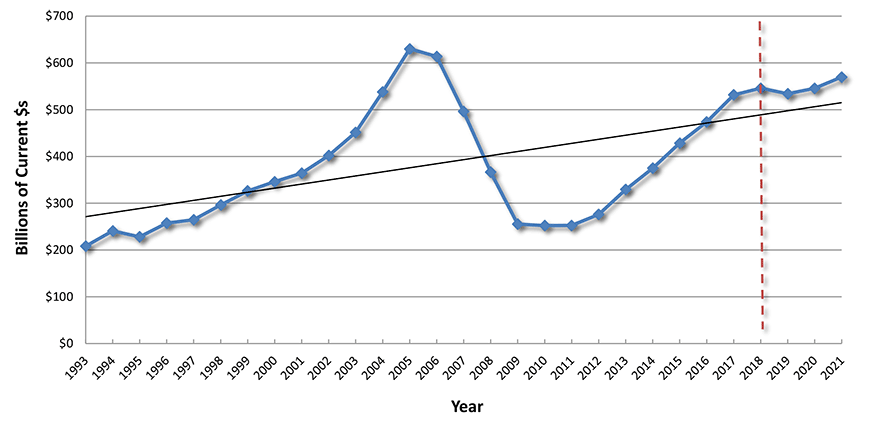
Chart: ConstructConnect
Hotel and Motel Construction Outlook
Over the past ten years, PIP construction spending in the ‘lodging’ type-of-structure category has been proceeding at a +7.4% annual average rate. The +7.4% figure has been the speediest increase among all nonresidential types of structure.
As Graph 3 shows, hotel and motel construction experiences notable cycles. There was a small peak in 2000, followed by a big spike in 2008, immediately prior to the recession. A long climb back up since 2011 appears to have reached another high-point at present, close to a match for 2008.
But a pause may soon be in the cards. Lodging PIP construction is estimated at +3.2% y/y in 2019 and forecast at -0.8% in 2020 and -4.8% in 2021. Hiring in the sector has pulled back from +3.0% annually two years ago to about half that pace currently, +1.4%.
(put-in-place investment)
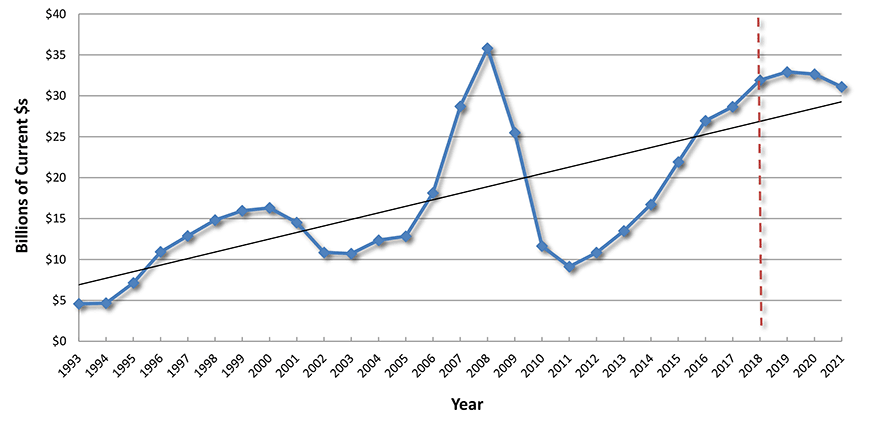
Chart: ConstructConnect
Office Construction Outlook
U.S. PIP office building construction performed admirably in 2018, +9.1% compared with 2017. Moreover, ConstructConnect expects another good result in 2019, +7.9%, before deceleration in 2020 and 2021, at +4.9% and +3.4% respectively.
Most encouraging for office space developers and builders is the tendency for incremental jobs generation nowadays to be based in the digital, data processing, Internet and other high-tech spheres. Such work requires office space.
Developers are coming to understand, though, that today’s tenants have different leasing demands. They want tougher security systems, extensive wiring capacity and greater flexibility in length-of-obligation terms.
(put-in-place investment)
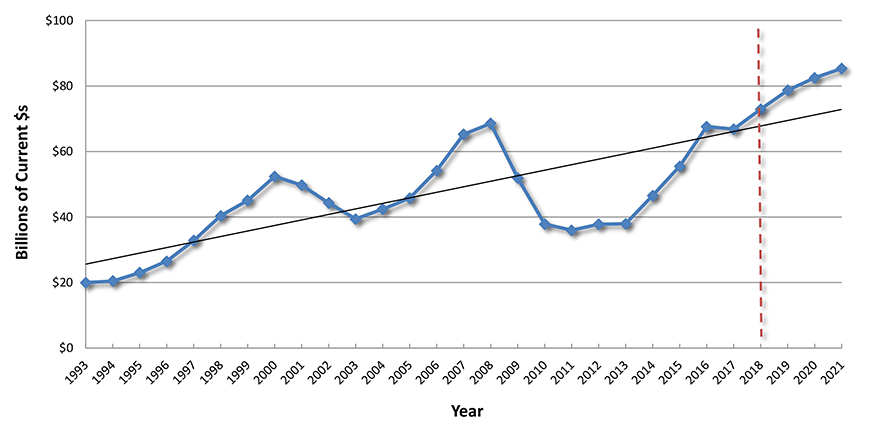
Chart: ConstructConnect
Commercial (Retail, Warehouse, Restaurant) Construction Outlook
The Census Bureau’s definition of ‘commercial’ construction encompasses three major sub-components: ‘bricks and mortar’ retail; warehouses; and dining and drinking establishments.
Well-publicized closures of many walk-through retail locations carries a double whammy for construction. Not only does it deter the building of new structures, but there’s also the matter of the ‘overhang’. Retail space that has been emptied out must first be utilized again, with leases signed by new vendors, before there can be any justification for building additional square footage.
The flip side to retail’s woes has been an offsetting explosion in warehouse work. Giant big box structures, sometimes staffed more by robots than by people, are being built to fulfil − by van, truck, rail and air − purchase orders placed on-line.
(put-in-place investment)
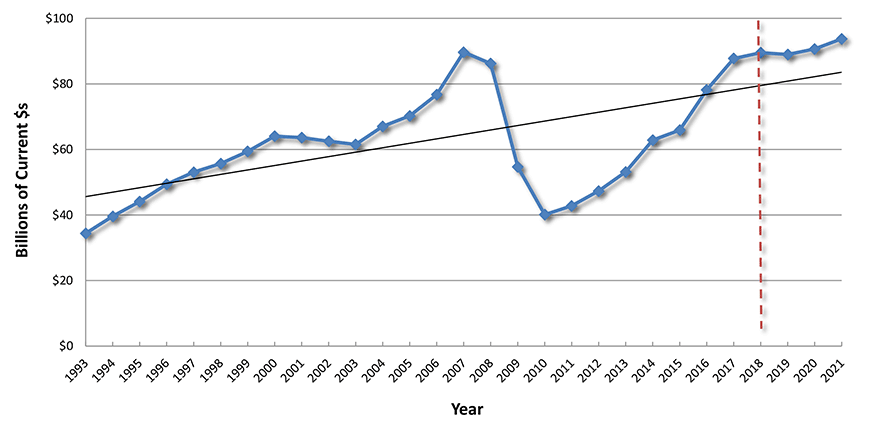
Chart: ConstructConnect
Hospital, Medical Clinic and Nursing Home Construction Outlook
Baby boomers were born between the mid-1940s and the mid-1960s. Simple math says that in 2020, they will be aged from 55 to 75. A popular narrative over the past decade or so has been how aging baby boomers will mean a greatly increased need for health care facilities. The problem is, though, it hasn’t been borne out by the facts.
Graph 6 shows PIP construction spending on health care facilities since 2002. There were significant increases until 2008. From 2008 through 2014, however, decreases prevailed and a mild recovery during the past several years has still not restored capital spending to its former heights.
The debate over health care funding in America continues to rage. It’s bound to be front and center again in the Presidential election to be held next year. Meanwhile, in recognition that the nation’s citizens will be requiring more ambulatory care services, to handle procedures such as knee and hip replacements, plus hernia repairs and cataract surgery, a wave of smaller medical clinic construction – often initiated and financed by doctors themselves – has been underway.
An expected surge in the building of seniors’ care facilities probably won’t get into full swing until the mid-2020s.
(put-in-place investment)
Numbers for this series prior to 2002 are no longer consistent with more current data.
Chart: ConstructConnect
Schools and Colleges Construction Outlook
As with health care facility construction, the building of schools and colleges has been struggling to return to pre-recession levels. The schooling construction market basically breaks down into two components, the lower grades (i.e., kindergarten to grade 12, often referred to as K-12) and higher education (i.e., colleges and universities).
Encouragement for K-12 construction comes from the children of baby boomers beginning to raise their own children. Millennials, as children of baby boomers, are rapidly turning their parents into grandparents. Mainly for this reason, ConstructConnect believes a 2012-2016 period of educational construction below trend is about to correct back above trend in 2019-2021.
But worth noting, also, is that at the level of higher education, portions of the potential student body are being lured away to abundant and well-paying jobs in the current buoyant economy. Thanks for this effect go to the record low unemployment rate. Furthermore, the influx of foreign students is no longer what it used to be. They aren’t feeling as welcome in America and are enrolling in academic institutions elsewhere.
(put-in-place investment)
Numbers for this series prior to 2002 are no longer consistent with more current data.
Chart: ConstructConnect
Manufacturing Construction Outlook
Due to a widespread embrace of automation, plus a tendency to move production offshore, there was a huge drop in U.S. manufacturing employment during much of the 00s. Nevertheless, the latest ten-year annual average rate of growth in the sector’s PIP construction has been a respectable +3.7%.
The corporate tax rate cut initiated in January 2018, with a scaling down to 21% from 35%, is also a stimulus to capital spending. But capacity utilization rates across manufacturing sub-sectors are generally stuck in a zone below the 80% level that would signal a next major round of assembly line additions.
Manufacturing construction will receive a double-digit percentage-rate growth boost, however, from a source that largely lay dormant for a long time. The refining and processing of energy extracts into petrochemical and chemical products and the building of terminals for the export of liquefied natural gas (LNG) is populating the industrial construction outlook with mega projects.
(put-in-place investment)
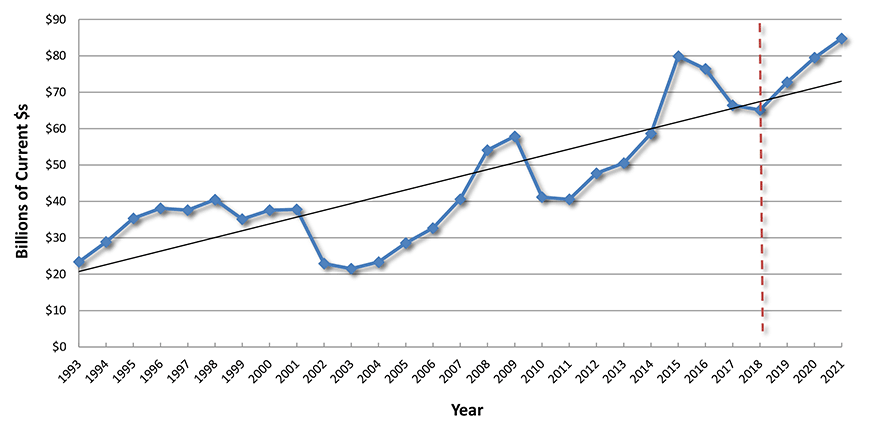
Chart: ConstructConnect
Engineering Construction Outlook
The study of statistics under the umbrella of econometrics features regression analysis. A useful tool in regression work is a measure of how closely actual data points, often gathered over a certain time frame, correlate with a trend line. Such a measurement is known as an R2 value.
R2 always lies between 0.00 and 1.00. The closer R2 is to 1.00, the better the fit between ‘trend’ and ‘actuals’. Econometricians are delighted to work with data that yields an R2 value of 0.85 or more. Engineering PIP construction includes several sub-categories with exceptionally high R2s.
Highways and Streets Construction Outlook
Bipartisan agreement between Republicans and Democrats has been rare of late, but President Trump, Nancy Pelosi and Chuck Schumer did recently find common ground on America’s need for massive new and repair infrastructure spending. There’s a full-to-the-brim basket of potential public sector projects encompassing roadwork, bridges, water and sewage treatment plants, dams and levees (i.e., to ward of flooding), etc. that warrant go-aheads.
November 2020, however, is rapidly approaching and election season, while not fully underway quite yet, will have an inordinately large influence on the legislative agenda over the next 16 months. Specific action to promote federal infrastructure spending is likely to be a casualty.
With the foregoing as background, it’s interesting to note, from Graph 9, that the R2 value of U.S. PIP construction spending on highways and streets is an impressive 0.897. History has shown that despite persistent problems tied to adequate funding uncertainty, long-term upward momentum in roadbuilding activity has been maintained regardless.
(put-in-place investment)
Numbers for this series prior to 2002 are no longer consistent with more current data.
Chart: ConstructConnect
Transportation Construction Outlook
‘Transportation’ construction, as defined by the Census Bureau, keys on structures and systems that foster people and goods mobility not related to roadwork. Expressed in simpler terms, it’s railways, rapid transit projects, airport runways and all related passenger terminals.
R2 for transportation PIP construction is an outstanding 0.9272. The temptation is to simply extend the trend from the past into the future. But this is a sub-category of engineering construction with far more than the usual potential. It is replete with proposed mega projects.
Numerous major cities across America are carrying out urban transit expansion programs. A next phase will feature ‘bullet’ trains to link cities near each other in the New York-Washington corridor and in Florida and Texas.
Finally, with truly staggering multi-billion budgets, there are the airport expansions being planned for many of the country’s international airports. ConstructConnect’s infographic on airport construction projects can be accessed by clicking on this link.
(put-in-place investment)
Numbers for this series prior to 2002 are no longer consistent with more current data.
Chart: ConstructConnect
Power Construction Outlook
‘Power’ is another sub-category of engineering construction with an elevated R2 value, 0.9225. As its name suggests, ‘power’ encompasses electricity generating stations and transmission lines, but it also entails much more.
‘Power’ includes other energy structures such as oil and natural gas pipelines. Several mega-sized pipeline projects are on the drawing boards (e.g., the Keystone XL expansion), but it has become inadvisable to count too dearly on them proceeding.
Even when they are given the green light by the President and a regulatory agency at the federal level, they are likely to be waylaid by another at the state level or halted by on-site protests and a string of court challenges.
(put-in-place investment)
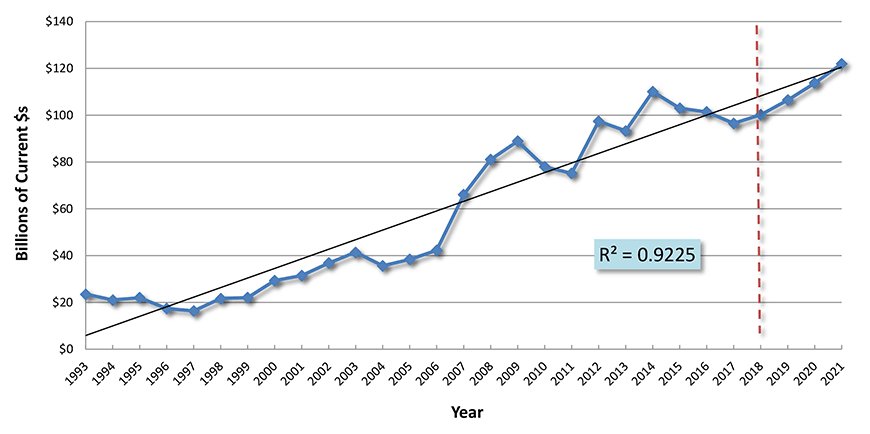
Chart: ConstructConnect
(put-in-place investment)
Numbers for this series prior to 2002 are no longer consistent with more current data.
Chart: ConstructConnect
(put-in-place investment)
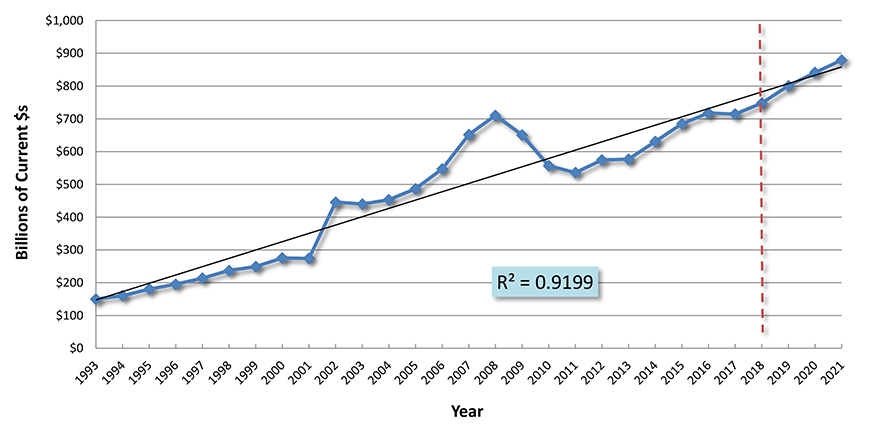
Chart: ConstructConnect








Recent Comments