Indications of a slowing in the economy of the U.S. appear frequently in November’s mid-month Nuggets report, which discusses some of the latest data releases from prominent public and private sector agencies.

Let’s get right to it.
(1) A Notable Decrease in Job Openings
An easy to reach conclusion would be that there must be a deceleration in jobs growth due to unemployment being near an all-time low. The seasonally adjusted (SA) unemployment rate is just 3.6% and the not seasonally adjusted (NSA) rate is even more spectacular, at 3.3%. Indeed, the average monthly increase in the total number of U.S. jobs this year, through October, has been +170,000, down by a quarter from 2018’s comparable figure of +230,000. That’s 50,000 fewer jobs, on average, per month. But there’s more to consider.
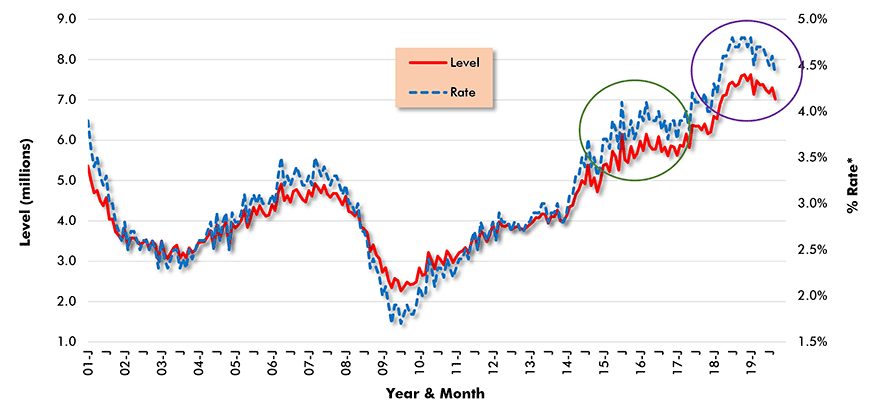
Graph 1 sets out job openings as calculated from September’s JOLTS report. The JOLTS acronym stands for Job Openings and Labor Turnover Survey. Since late last year, and highlighted within the far-right circle in the graph, there have been declines in both the ‘level’ and the ‘rate’ of total job openings in the U.S.
Post-recession, there was one other period when U.S. job openings tailed off, from mid-2015 through the end of 2016 (also circled). That stretch of weakness turned out to be a false reading. It was also the case, though, that neither the ‘level’ nor ‘rate’ curves in the earlier period dipped to quite the same extent as recently. The rate, especially, stayed relatively flat, rather than diving.
Graph 1: U.S. Total Jobs Openings (from JOLTS Report)

JOLTS − Job Openings and Labor Turnover Survey.
(2) Not so Great Retail Sales
U.S. gross domestic product (GDP) growth has become increasingly reliant on consumer spending. Personal consumption expenditures (PCE) now comprise 70% of the nation’s output. Therefore, it’s important that retail sales, as a big chunk of PCE, keep chugging along.
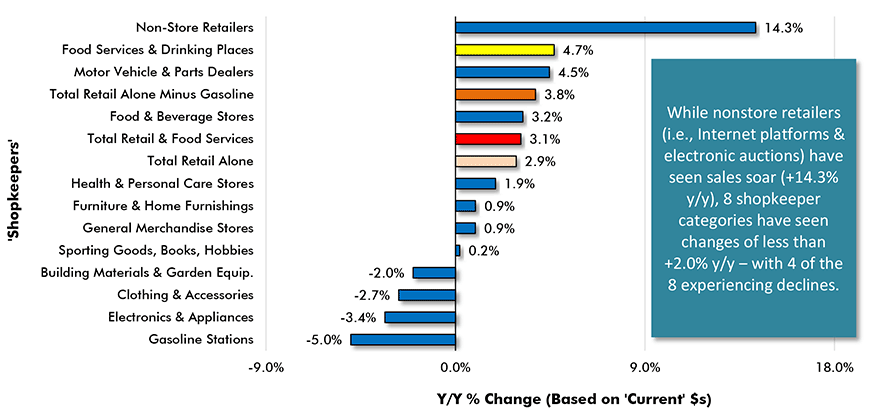
Graph 2 shows the year-over-year (y/y) sales performances of America’s major shopkeeper categories. ‘Non-store’ retailers, made up primarily of Internet platforms and electronic auction houses, have done amazingly well, +14.3% y/y. Also encouraging is the +4.5% y/y gain realized by motor vehicle and parts dealers. Plus, ‘food and beverage’ stores have done alright, at +3.2%.
Beyond those three sub-categories, though, the cash register results have been far from stellar. Year-over-year sales figures from eight shopkeeper categories have been under +2.0%, with four of the eight ‒ including ‘building materials and garden equipment suppliers’ (-2.0%) ‒ experiencing declines.
(3) Signs of a Changing Retail Landscape Everywhere
America’s retail landscape keeps changing, and it’s not just about ‘bricks and mortar’ selling locations falling by the wayside with the ascendancy of online browsing and purchasing. Ten or twenty or fifty years ago it would have seemed inconceivable that milk producers might ever fall into hard times. Not so now. Dean Foods, the maker of Land O’Lakes milk products, and largest processor in the country, has made headlines for seeking bankruptcy protection. Sales of traditional cow’s milk, once a staple in nearly everyone’s diet, have been plummeting for several years. A younger generation of consumers has been seeking out ‘trendier’ alternatives.
Once again, though, there’s a fair bit more to the story. The uphill climb for Dean Foods was made a lot steeper a year ago when Walmart pulled out of its supply contract with the firm after building production facilities of its own.
Graph 2: U.S. Retail & Food Services Sales Y/Y – October, 2019

(4) Household Debt Reaches New Milestone, but Not as Scary as Seems
Further concerning consumer expenditures, and the ability of householders to maintain their current momentum, there is the not so small matter of debt. Household debt has five major components: mortgages, home equity lines of credit (HELOCs), auto loans, credit cards and student loans.
According to the Federal Reserve Bank of New York’s Center for Microeconomic Data, total U.S. household debt has reached an all-time high of -14 trillion ‘current’ dollars, up by one-quarter from Q2 2013’s post-recession trough level of -10.5 trillion dollars. The dire consequences of the 2008-09 recession caused many Americans to go on a belt-tightening spree to straighten out their finances.
While -$14 trillion sounds, on first blush, alarmingly bad, it’s not quite as scary as one might suppose. It’s only $1.3 trillion more than the previous peak reached in 2008 and since then, the economy has grown much bigger. Furthermore, the effects of inflation have not been factored out. In 2008, the U.S. household debt to GDP ratio was nearly 100%. Presently, it has pulled back to 76%. Also, household-borrowing-to-income has become relatively restrained and fewer citizens are filing for bankruptcy.
(5) Student and Auto Loans Problematic
At a little more than two-thirds (68%) of the total, homeowner mortgages continue to account for the biggest portion of household debt. Foreclosures, in a historical context, however, are currently minimal. HELOC activity (only 3% of total debt) has been contracting over the past ten years, while credit card activity (6% share) has been expanding. Where debt has been climbing most rapidly has been in auto loans (a 9% share of the total) and student loans (an 11% share).
As for balances that are in arrears, student loans have soared to the top of the problem list. 11% of student loans are either in default or are delinquent by 90 days-plus. Next in line are credit cards, with a more than 8% failure record, followed by auto loans, just under 5%. HELOCs and mortgages are currently barely registering any difficulty.
The bottom line is that U.S. consumers, if a recession soon hits, will be entering it with fewer financial encumbrances than in the past. Worth keeping in mind, though, is that a major intent of the Federal Reserve’s interest-rate-lowering program is to encourage more spending throughout the economy to be achieved by loading up on more debt.
(6) A Railroad Giant’s Layoff Announcement
CN Rail, which has extensive operations in the U.S. and Canada, has announced that it plans to cut staffing by 1,600 jobs. A weakening North American economy and ongoing global trade tensions are being blamed for freight haulage reductions.
Slowdowns are always marked by announcements of layoffs. Is CN Rail’s pending move a harbinger of things to come? Initial jobless claims for November 9th moved up to 225,000, not terribly worrisome on its own. Still, it’s higher than the figures slightly below 200,000 that were recorded on a couple of occasions in April of this year.
(7) Awesome Multi-family Dominance in Canada’s New Homes Market
Canadian housing starts in October were 202,000 units seasonally adjusted and annualized (SAAR), quite close to their ten-year ‘standard’ level of 200,000. Monthly average starts to date this year have been 210,000 units, -1.3% compared with January-October 2018’s 213,000 units. The pattern in the U.S. has been similar, with monthly average starts through September -1.5% year to date.
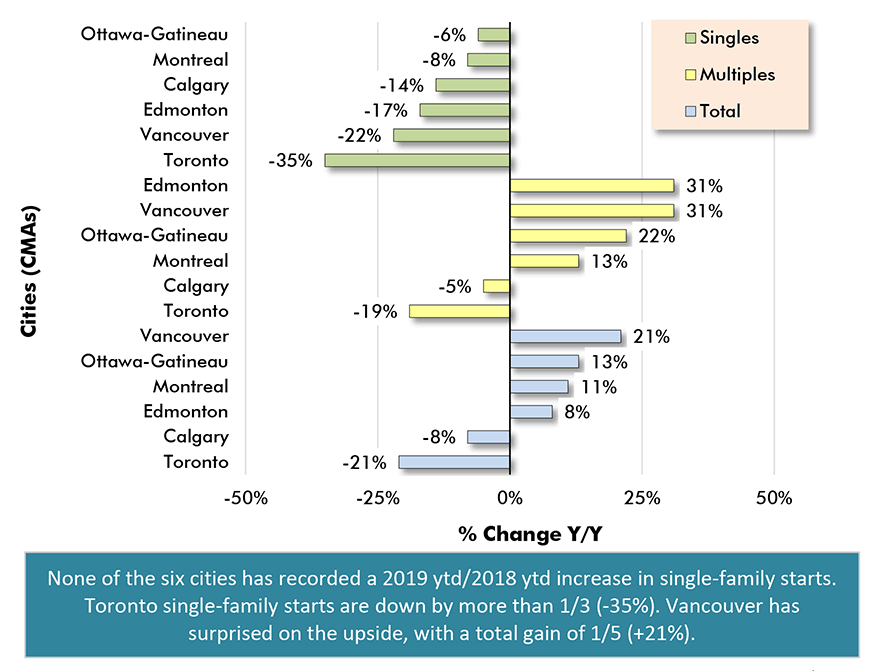
Total new home starts in Toronto this year are -21.0% compared with last year. Despite the one-fifth decline, and as laid out in Graph 3, nominal residential groundbreakings in Toronto lead all cities in both the single-family and multi-family markets. As an interesting sidebar, Edmonton has managed to nearly match Toronto in the single-family market.
Multi-family starts have accounted for nearly four-fifths (79%) of total family starts in Canada this year. The multi-family’s share in Canada’s three most populous cities has been even higher, 87% in both Toronto and Vancouver and 91% in Montreal.
Graph 3: Housing Starts in Canada’s 6 Most Populous Cities
Jan-Oct 2019 Actuals

Graph 4: Housing Starts in Canada’s 6 Most Populous Cities
Jan-Oct 2019 vs Jan-Oct 2018

(8) Rapid Fire Round
First, as a point of encouragement, consumer confidence in the U.S., while down a bit from its peak, remains solid. The Conference Board’s October index value of 125.9 was essentially flat versus September’s 126.3. 125.9 is impressively strong, given that ‘neutral’ is 100.0. The base level of 100.0 was established in 1985, when sentiment was neither bubbling up nor sinking.
Second, the purchasing managers’ index (PMI) of the Institute of Supply Management (ISM) has now been a notch or two below 50.0% for three months in a row, indicating that while GDP continues to make some forward progress, the manufacturing sector has hit a soft spot. The capacity utilization rate in the sector stepped back to only 74.7% in October from 75.2% in September. In October of last year, it had been 76.8%.
Third, while the economy is nearly always fascinating, there’s an event on the political front that is vacuuming up a lot of the air in the room. The impeachment hearings are a compelling televised story and, unfortunately, you can’t just skip to the last page and discover how it ends.
Alex Carrick is Chief Economist for ConstructConnect. He has delivered presentations throughout North America on the U.S., Canadian and world construction outlooks. Mr. Carrick has been with the company since 1985. Links to his numerous articles are featured on Twitter @ConstructConnx, which has 50,000 followers.


Recent Comments
comments for this post are closed