Hiring in Canada took a pause in October according to the latest Labour Force Survey report from the nation’s chief statistics-gathering agency. Statistics Canada says that total employment in the tenth month of the year stayed almost the same (-2,000 jobs) as in September.

Both the seasonally adjusted (SA) unemployment rate (5.5%) and the participation rate (65.7%) remained unchanged. When Canada’s SA unemployment rate is adjusted to the same calculation methodology as is used in the U.S., it drops to 4.4% and appears more favorably when held up against America’s October SA jobless rate of 3.6%.
The not seasonally adjusted unemployment (NSA) rates in Canada and the U.S. in the latest month, with the Canadian figure calculated according to U.S. methodology, were a not-that- dissimilar and truly quite tight 4.1% and 3.3% respectively.
Canada’s total jobs increase over the past 12 months has been +442,000, a stunning advance. In the prior 12 months, the gain was +221,000.
The average monthly improvement in Canadian employment so far in 2019 has been +36,000 jobs, more than three times last year’s January-to-October average monthly advance of +11,000.
Services Jobs have Grabbed all the Glory
Canadian workers in the manufacturing and construction sectors, though, had no reason to cheer concerning their ongoing employment prospects in October. The former shed 24,000 jobs and the latter cut its payroll count by 21,000.
Manufacturing’s average monthly jobs change to date in 2019 has been -2,000. Construction hasn’t done much better. Its monthly average change has been a barely positive +1,000.
Service sector jobs, however, have been an entirely different and cheerier story. Canadian services jobs in 2019 so far have recorded an average monthly pickup of +39,000, more than three times greater than 2018’s +12,000 for the same time frame.
The Canadian services sub-sector with the biggest bump in employment in the latest month was ‘finance, insurance, real estate, rental and leasing’, +18,000.
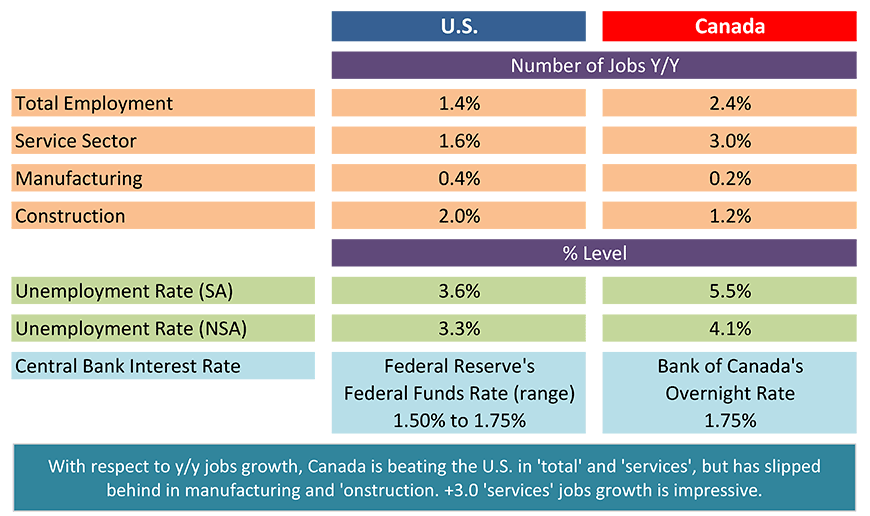
With respect to year-over-year (y/y) percentage changes in employment, Table 1 shows that Canada is currently a stride or two ahead of the U.S. in ‘total’ (+2.4% to +1.4%) and ‘services’ jobs (+3.0% to +1.6%), but is trailing in manufacturing (+0.2% to +0.4%) and construction (+1.2% to +2.0%) jobs.
Canada’s exceptional jobs creation record this year explains why the Bank of Canada has been reluctant to lower its trend-setting ‘overnight rate’, keeping it at 1.75%, while the Federal Reserve has proceeded with three 25 basis-point cuts (where 100 basis points = 1.00%) that have reduced the federal funds rate from a top range of 2.25% to 2.50% to a present range of 1.50% to 1.75%.
Table 1: U.S. and Canadian Jobs Markets – October, 2019

U.S. labor data is from a ‘payroll survey’ / Canadian labour data is from a ‘household survey’.
Canadian NSA unemployment rate ‘R3’ is adjusted to U.S. concepts (i.e., it adopts U.S. equivalent methodology).
Table: ConstructConnect.
In Provincial Labour Markets, Ontario and Quebec the Pacesetters
Some of Canada’s October regional labour market highlights were as follows:
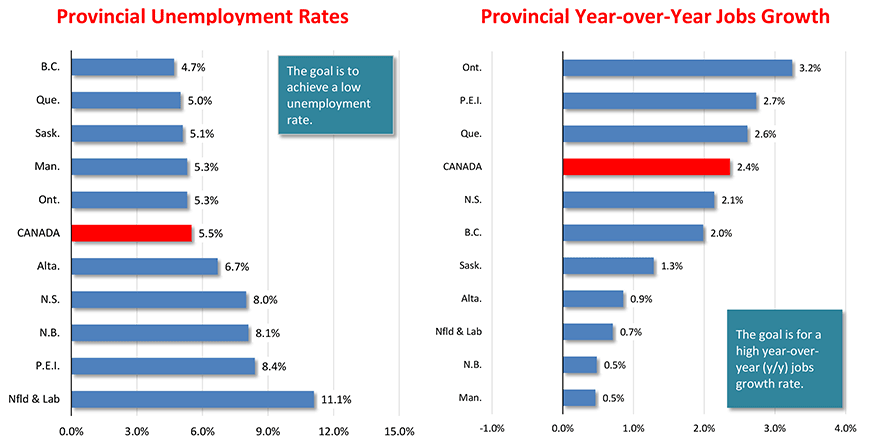
- Ontario, with a little less than 40% of the nation’s total population, has accounted for 53% of Canada’s net number of jobs increase over the past 12 months (+236,000 out of +442,000);
- Quebec (with a 23% share of Canada’s population) has contributed one-quarter (25.1%) of the nation’s total year-over-year jobs jump;
- Ontario and Quebec combined have been the source of nearly 80% of the total year-over-year jobs climb;
- In percentage terms, employment in eastern Canada (from Ontario to the Atlantic Ocean) is +2.9% y/y;
- Employment in western Canada (from Manitoba to the Pacific Ocean) is ahead by +1.3%;
- British Columbia in the West, however, currently has the lowest unemployment rate among all provinces, at 4.7% SA; and
- Quebec is in second spot for best joblessness, 5.0%.
| Unemployment rate | Employment (000s) | |||||||
| Province | OCT 2018 | OCT 2019 | oCT 2018 | oCT 2019 | Net | % change | ||
| Newfoundland and Labrador | 12.5% | 11.1% | 226.1 | 227.7 | 1.6 | 0.7% | ||
| Prince Edward Island | 7.2% | 8.4% | 76.8 | 78.9 | 2.1 | 2.7% | ||
| Nova Scotia | 7.6% | 8.0% | 457.7 | 467.5 | 9.8 | 2.1% | ||
| New Brunswick | 7.3% | 8.1% | 352.9 | 354.6 | 1.7 | 0.5% | ||
| Québec | 5.3% | 5.0% | 4,258.9 | 4,370.1 | 111.2 | 2.6% | ||
| Ontario | 5.6% | 5.3% | 7,267.4 | 7,503.1 | 235.7 | 3.2% | ||
| Manitoba | 6.1% | 5.3% | 650.3 | 653.3 | 3.0 | 0.5% | ||
| Saskatchewan | 6.1% | 5.1% | 575.4 | 582.8 | 7.4 | 1.3% | ||
| Alberta | 7.2% | 6.7% | 2,336.9 | 2,356.9 | 20.0 | 0.9% | ||
| British Columbia | 4.2% | 4.7% | 2,518.5 | 2,568.5 | 50.0 | 2.0% | ||
| Canada | 5.7% | 5.5% | 18,720.9 | 19,163.4 | 442.5 | 2.4% | ||
Graph 1: Canada’s Provincial Labour Markets – October 2019

Chart: ConstructConnect.
Good News about Canadian Wages
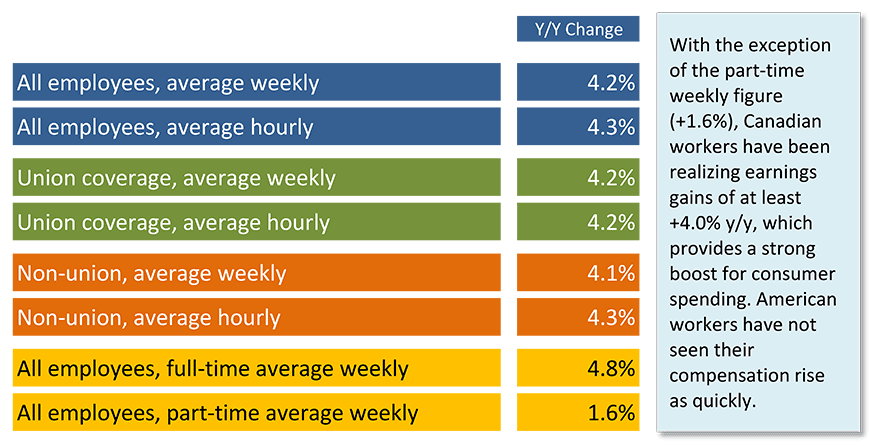
Perhaps the October Canadian labour market statistics that stand out most are compensation results. Table 3 shows the y/y earnings of Canadian workers, hourly and weekly, and by union or non-union status.
In every instance, except for part-time employees weekly (+1.6% y/y), the pay cheque rise has been more than +4.0% y/y. U.S. comparable numbers remain stuck in a range of +2.5% to +3.5%.
Low unemployment, good jobs creation and upward income mobility all help fuel healthy consumer spending, which is a mainstay of gross domestic product (GDP) growth.
Table 3: Canadian Workforce Earnings,
Year over Year – September 2019

(‘Current’ means there has been no scaling back to remove effects of inflation.)
Table: ConstructConnect.


Recent Comments
comments for this post are closed