
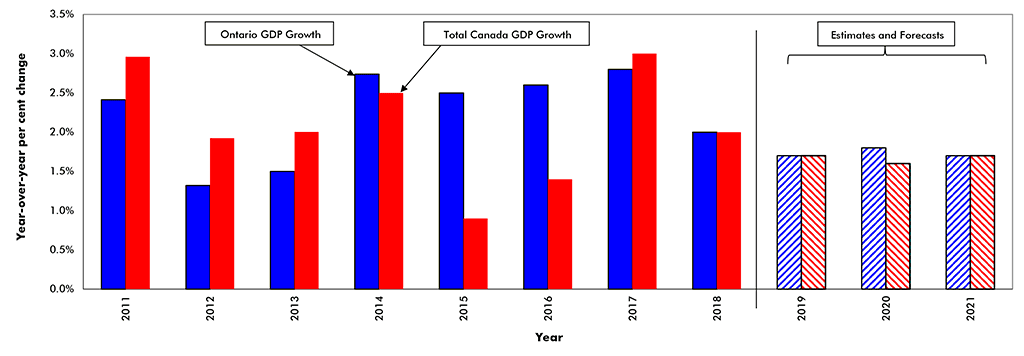
We gave Ontario’s overall economic performance during 2019 a “C”. This grade is based on data released up to the end of the year which indicates that the province grew by 1.7% y/y in 2019. This estimate, also the national average, is, not surprisingly, mid-way between the 2.8% y/y high posted by Prince Edward Island and the 0.6% y/y low, recorded by Alberta and Saskatchewan.
While the province rated a “C” overall, there was significant variation in the performance of its key sectors. After exhibiting little growth in 2018, the province’s exports rose by an estimated 3.8% in 2019 against the headwind of slower global growth. This gain was in large part driven by increased foreign sales of gold, motor vehicles and motor vehicle parts. Although the outlook for exports is overshadowed by the pending ratification of the United States, Mexico, Canada free trade agreement, recent forward-looking indicators of growth in Asia and the U.S. suggest that exports will continue to make a positive contribution to Ontario’s growth in 2020.
One of the most significant contributors to Ontario’s economic growth over the past several quarters has been very strong population growth, the result of an unprecedented increase in net international migration augmented by sustained net interprovincial migration. Indeed, over the past two years, net migration into the province has totaled 434,000 individuals, up 35% compared to the previous two years.
Against this background of strong population growth and despite the tepid GDP result, on a par with the average of the country as a whole, Ontario accounted for 80% of jobs added in Canada over the past year. Moreover, 84% of the new jobs were full time and the bulk, 69%, were in the private sector. With the province’s unemployment rate near a 30-year low and its job vacancy rate at a 15-year high, it appears unlikely firms will be cutting back on hiring anytime soon.
Despite the above-noted record net migration and the concomitant very strong pattern of job growth, residential construction got off to a weak start in 2019, due in large part to the lingering impact of the mortgage stress test introduced by the Federal government at the beginning of 2018. However, the combination of stronger employment growth, an easing in mortgage stress test rules and an uptick in weekly earnings appears to have given a significant boost to both home builders and buyers in the second half of 2019. Looking ahead, given stable affordability, strong net migration plus the Ontario government’s plans to increase the supply of both ownership and rental accommodation, we expect housing starts in 2020 and 2021 to total in the range of 79,000 and 82,000 units which is up from an estimated 70,800 units in 2019.
The other significant drag on growth last year was a slowdown of investment in non-residential building. After posting growth of 8.6% y/y in 2017 and 5.0% in 2018, the volume of non-residential building year to date in 2019 is down by 8% primarily on account of declines in spending on hospitals (-28%) and office buildings (-14%). Looking ahead to 2020, the outlook for non-residential building is brighter due to an increase in plans to build manufacturing plants, warehouses, and recreational facilities. Also, near term non-res construction spending will be underpinned by ongoing work on the Eglington Crosstown light rail system, to be completed in 2021, and the refurbishment of the Darlington Nuclear Plant. Other major projects include, the refurbishment of the Bruce Power Plant, expected to take ten years, and the Gordie Howe Bridge, expected to take six years. Major engineering projects we expect to come off the drawing boards in the near term include the Ontario Line Transit extension, the Yonge Subway Extension, and the Scarborough Subway Extension.
Given that the current expansion, which started in 2008, is the longest on record, there is an increased risk that it will wind down before the end of this year. And while there is evidence of shortages of skilled labour, particularly in the construction trades, inflation remains quiescent. Consequently, the Bank of Canada appears in no hurry to adopt a more restrictive policy stance, leading to higher interest rates, anytime soon.
While growth in 2020 should be supported by sustained trade, stronger residential construction and a pickup in business investment, our expectations for overall growth are tempered by relatively lacklustre growth of consumer spending and the prospect that high debt levels will curb spending well into 2020.
John Clinkard has over 35 years’ experience as an economist in international, national and regional research and analysis with leading financial institutions and media outlets in Canada.
Real* Gross Domestic Product (GDP) Growth — Ontario vs Canada


Recent Comments
comments for this post are closed