Total U.S. Construction Spending Stayed Stuck at $1.3 Trillion in 2019
As the sum of its monthly not seasonally adjusted (NSA) figures, the Census Bureau has calculated that total U.S. put-in-place construction in 2019 was $1.303 trillion. The total dollar volume last year was -0.3%, or flat, compared with 2018. (2018 had been +3.3% relative to 2017.)
Residential construction ($521 billion), which is about 40% of the total, was -4.6% year over year. Nonresidential construction ($782 billion), with an approximate 60% share, was +2.8%.
There are only six sub-categories of nonresidential that account for 5.0% of total put-in-place construction and their full-year 2019 performances versus full-year 2018 were as follows: ‘office’, +6.3%; ‘commercial (retail, warehouse and restaurant)’, -11.3%; ‘educational’, +0.2%; ‘power (electricity, oil and gas)’, +6.6%; ‘highway and street’, +8.8%; and ‘manufacturing’, +4.3%.
Two sub-categories which, surprisingly, contribute shares-of-total slightly less than 5.0% are ‘health care’ (+3.4% y/y) and ‘transportation’ (+6.4% y/y). As the general population continues to age, due to ‘baby boomers’ moving further along in life, and as increasingly large amounts of money are spent on railroad and rapid transit projects, both sub-categories will likely increase their shares-of-total in the years ahead.
PIP Construction Growth has Closely Correlated with GDP Growth
Graphs 1 through 3 set out the historical monthly records, from January 2010 on, of put-in-place construction spending according to ‘total’, ‘residential’ and ‘nonresidential’. The curves are based on monthly ‘actuals’ that have been seasonally adjusted and annualized. The resulting figures are what are known as SAAR numbers.
The top curve in Graph 1 establishes that total U.S. put-in-place (PIP) construction spending has shown little upward movement over the past three years, from 2017 through 2019.
From the bottom curve in Graph 1, the best years for growth in total PIP construction occurred from mid-2013 through early-2016. In much of 2019, the year-over-year percentage change was negative. By the fall, however, it had climbed back above 0.0% and it ended the year at +5.0%, thanks to a recovery in residential work.
Note that the latest 10-year average change in ‘total’ PIP construction (i.e., calculated as the average of each month’s y/y change for the past 120 months) has been +4.0%. The PIP numbers are in ‘current’ dollars. If a ‘standard’ +2.0% inflation rate is removed, the ‘real’ rate of change has been about +2.0%, which closely correlates with average annual gross domestic product (GDP) growth over the period.
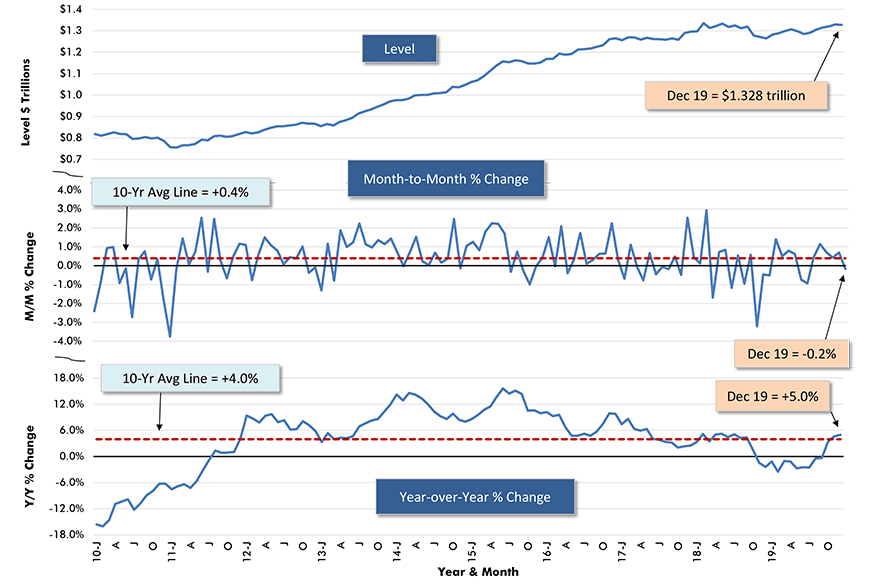
Chart: ConstructConnect.
Will Homebuilding Rescue the Economy from Recession?
From the top curve of Graph 2, residential PIP construction spending peaked at the beginning of 2018. Afterwards, it kept falling until the summer of last year. Since then, there’s been a mild pickup.
The year-over-year change in residential construction activity, as appearing in the lower curve of Graph 2, deteriorated sharply all the way through 2018 until it bottomed out at nearly -12.0% in February 2019. Coincident with a program of cuts in interest rates initiated by the Federal Reserve, the y/y change in residential PIP construction climbed out of its deep hole in quarters one to three of last year, crossed above zero in October and ended the year at +5.8%.
A revival in housing starts has been underway. Foundation work for new homes rose to 1.6 million units for the first time since the 2008-09 recession in the final month of 2019.
Over the past many decades, during periods of GDP expansion, strong home starts have played an important role in driving economic activity. Such has not been the case this time around. Some high y/y percentage increases were achieved only because of low base numbers.
Therefore, it would be a remarkable turn of events if a stronger homebuilding sector finally kicked in and helped forestall a recession.
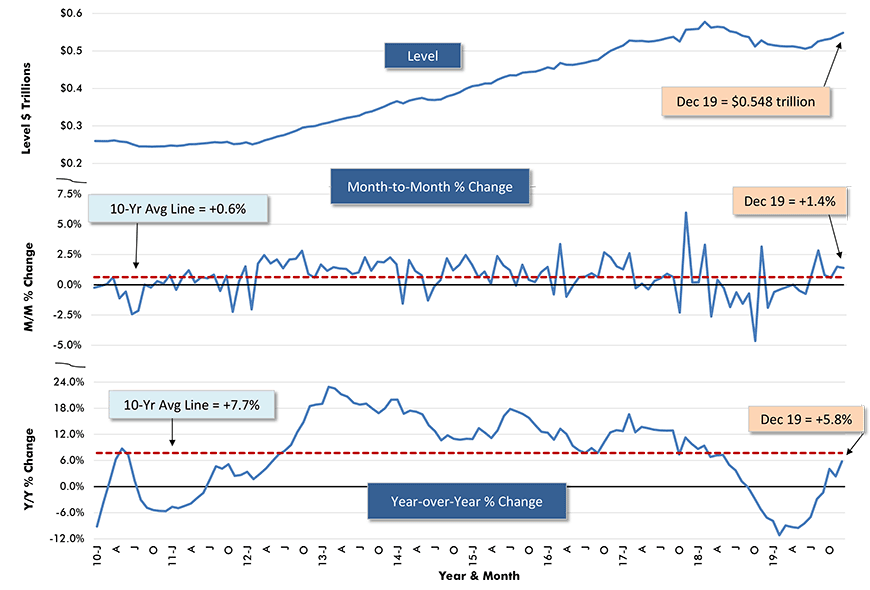
Chart: ConstructConnect.
Nonresidential PIP Construction has Set a Less than Blistering Pace
Nonresidential PIP construction spending, which at close to 60% is a bigger portion of the total than residential, flattened in 2019, as can be seen from the top curve in Graph 3. It had gradually trended upward from 2016 through much of 2018, after climbing more emphatically from 2013 through mid-2015.
December 2019’s nonresidential PIP construction spending result, although +4.4% year over year, was -1.2% month-to-month.
The 10-year average of monthly y/y changes for nonresidential PIP construction has been only +2.2%.
The next section will delve more fully into nonresidential construction and examine what is occurring in sub-sector markets.
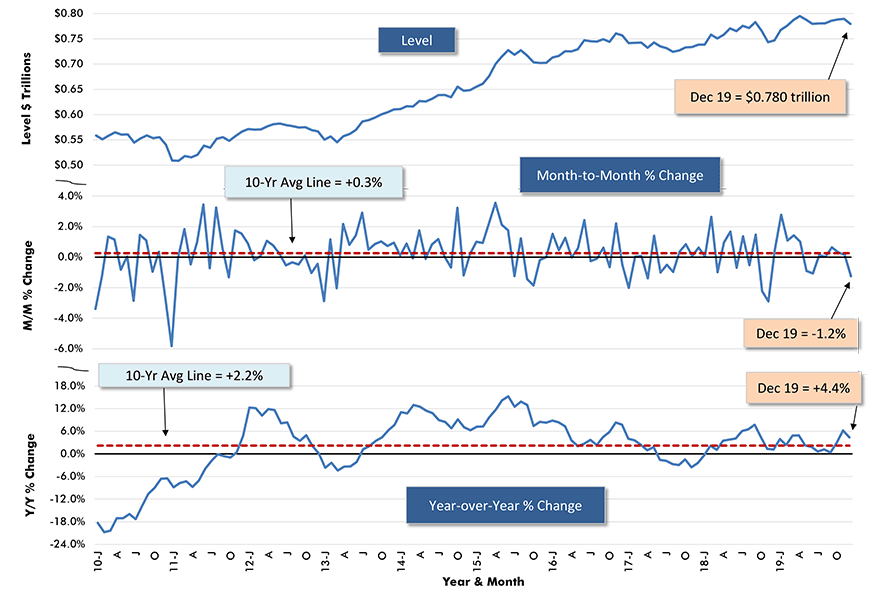
Chart: ConstructConnect.
Total PIP Spending has been Speeding Up of Late
Table 1 is a useful way to determine where, according to types of structure, PIP construction spending is heating up or cooling off ‒ except the terminology adopted is ‘speeding up’ versus ‘slowing down’.
The methodology is to compare latest-12-months-over-prior-12-months percentage changes versus latest-three-months-over-prior-three-months percentage changes, with the latter being annualized (i.e., projected to an annual rate of change).
When the three-month rate is more positive than the 12-month rate (or less negative, if both numbers are below zero), then it’s considered to be an instance of ‘speeding up’. When the three-month rate is less positive than the 12-month rate (or more negative, if both numbers are below zero), then ‘slowing down’ is judged to be happening.
The methodology in Table 1 can be used throughout the year. In December, however, there’s the anomaly that the percentage changes in the year-to-date column are the same as in the latest-12-months-over-previous-12-months column.
From Table 1, ‘total’ U.S. put-in-place construction spending has been speeding up of late, with support coming from residential activity, with nonresidential acting as a drag.
Among nonresidential sub-categories, the mix between speeding up and slowing down has been about equal, with seven in the former category and eight in the latter. For ‘conservation and development’, the difference is too minor to register.
Looking only at sub-categories that account for 5.0% of the total or more, the two where PIP spending has been ‘speeding up’ the most have been: ‘manufacturing’, with a swing from +4.2% to +18.8%, and ‘educational’, with a swing from 0.0% to +9.8%.
The three major sub-categories where PIP spending has been slowing down have been: ‘lodging’, with a swing from +6.1% to -14.8%; ‘power (electricity and oil and gas work)’, from +6.6% to -5.1%; and ‘highway and street’, from +10.2% to +2.2%.
Table 1: U.S. Put-in-place Construction Investment − December, 2019
Based on ‘current’ (i.e., not adjusted for inflation) $s, seasonally adjusted at annual rates (SAAR)
| Weighting of type-of-structure category (% of total $s) |
Year to date 2019/ Year to date 2018 (from monthly averages of saar data) |
Latest 12 mons vs. previous 12 mons | Latest 3 mons vs. previous 3 mons (annualized) |
Slowing Down 1 of 3 ‘Total’ categories / 8 of 16 sub-categories |
Speeding Up 2 of 3 ‘Total’ categories / 7 of 16 sub- categories |
||||||||
| Total Construction | 100.0% | -0.2% | -0.2% | 6.9% | ✔ | ||||||||
| Total Residential | 41.3% | -4.7% | -4.7% | 15.0% | ✔ | ||||||||
| Total Nonresidential | 58.7% | 3.0% | 3.0% | 1.8% | ✔ | ||||||||
| Lodging | 2.3% | 6.1% | 6.1% | -14.8% | ✔ | ||||||||
| Office | 6.0% | 6.4% | 6.4% | 0.0% | ✔ | ||||||||
| Commercial (retail) | 6.2% | -11.0% | -11.0% | 0.2% | ✔ | ||||||||
| Health care | 3.2% | 3.4% | 3.4% | -3.0% | ✔ | ||||||||
| Educational | 7.4% | 0.0% | 0.0% | 9.8% | ✔ | ||||||||
| Religious | 0.2% | -11.1% | -11.1% | 5.7% | ✔ | ||||||||
| Public safety | 0.8% | 7.5% | 7.5% | 13.5% | ✔ | ||||||||
| Amusement and recreation | 2.0% | -0.4% | -0.4% | -3.5% | ✔ | ||||||||
| Transportation | 4.1% | 6.5% | 6.5% | -3.8% | ✔ | ||||||||
| Communication | 1.8% | -4.9% | -4.9% | -2.3% | ✔ | ||||||||
| Power (electric; oil & gas) | 7.3% | 6.6% | 6.6% | -5.1% | ✔ | ||||||||
| Highway and street | 7.5% | 10.2% | 10.2% | 2.2% | ✔ | ||||||||
| Sewage and waste disposal | 2.0% | 8.4% | 8.4% | -8.8% | ✔ | ||||||||
| Water supply | 1.4% | 7.1% | 7.1% | 29.5% | ✔ | ||||||||
| Conservation and development | 0.8% | 12.8% | 12.8% | 13.5% | |||||||||
| Manufacturing | 5.6% | 4.2% | 4.2% | 18.8% | ✔ |
In the final two columns, if there is no check mark in the cell, then the type-of-structure category has stayed within 1.0%, up or down.
A negative that becomes more negative is considered to be ‘slowing down’; if less negative, then ‘speeding up’.
Data source: Census Bureau / Table: ConstructConnect
Alex Carrick is Chief Economist for ConstructConnect. He has delivered presentations throughout North America on the U.S., Canadian and world construction outlooks. Mr. Carrick has been with the company since 1985. Links to his numerous articles are featured on Twitter @ConstructConnx, which has 50,000 followers.








Recent Comments
comments for this post are closed