Key Indicators Reference Table
I want to be writing about improving economic statistics, and they will come in Q3 and Q4 of this year, but I can’t just ignore the lead-in data as it is being released.

Table 1 is a handy reference guide to the deterioration in the key numbers at this present moment in time.
There are some truly eye-popping percentage declines set out below.
With states and provinces currently re-opening, however, there is good reason to believe the worst is behind us.
| U.S. | Canada | ||
| Current $ Value of GDP | $21.5 trillion USD Q1 2020 |
$2.3 trillion CAD Q1 2020 |
|
| Change in ‘Real’ (inflation-adjusted) GDP | -5.0% Q1 2020 vs Q4 2019 |
-8.2% Q1 2020 vs Q4 2019 |
|
| Consumer Spending | -6.8% Q1 2020 vs Q4 2019 |
-9.0% Q1 2020 vs Q4 2019 |
|
| Total Retail Sales | -15.1% month/month (m/m) -17.8% year/year (y/y) April 2020 |
-10.0% month/month (m/m) -8.4% year/year (y/y) March 2020 |
|
| Motor Vehicle & Parts Retail Sales | -12.4% m/m -32.9% y/y April 2020 |
-35.6% m/m -33.2% y/y (y/y) March 2020 |
|
| Unemployment Rate | 14.7% seasonally adjusted (SA) April 2020 |
13.0% seasonally adjusted (SA) April 2020 |
|
| Total Jobs Count | -13.5% m/m -12.9% y/y April 2020 |
-11.0% m/m -15.0% y/y April 2020 |
|
| Construction Jobs Count | -12.8% m/m -11.2% y/y April 2020 |
-21.1% m/m -19.8% y/y April 2020 |
|
| Housing Starts | 891,000 units, SA & annualized April 2020 |
166,000 units, SA & annualized April 2020 |
|
| Inflation | +0.3% ‘all-items’ y/y -32.0% gasoline y/y April 2020 |
-0.2% ‘all-items’ y/y -39.3% gasoline y/y April 2020 |
|
| Central Bank Interest Rate | Essentially Zero | Essentially Zero |
Chart: ConstructConnect.
U.S. Q1 GDP Change -5.0%
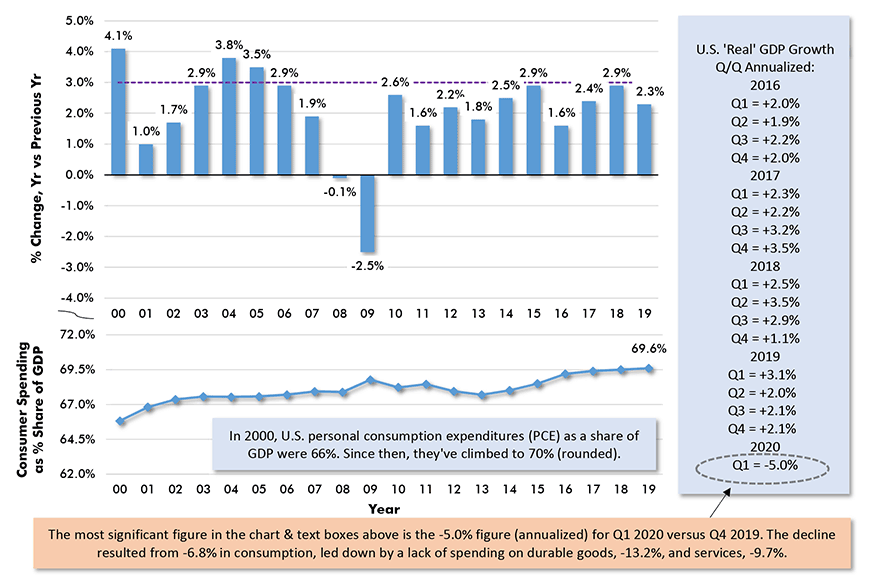
The latest estimate from the Bureau of Economic Analysis (BEA) is that the U.S. got off to an even rockier start in 2020 than first thought. Q1’s inflation-adjusted gross domestic product (GDP) change was -5.0% annualized (i.e., quarter to quarter projected out to a full year).
U.S. personal consumption expenditures in Q1 were -6.8%. Durable goods spending (on vehicles, appliances and furniture) within consumer spending were -13.2%. Expenditures on services also experienced softness, -9.7% annualized.

Chart: ConstructConnect.
Canada Walking an Obstacle-Strewn Path; -8.2% Q1 GDP
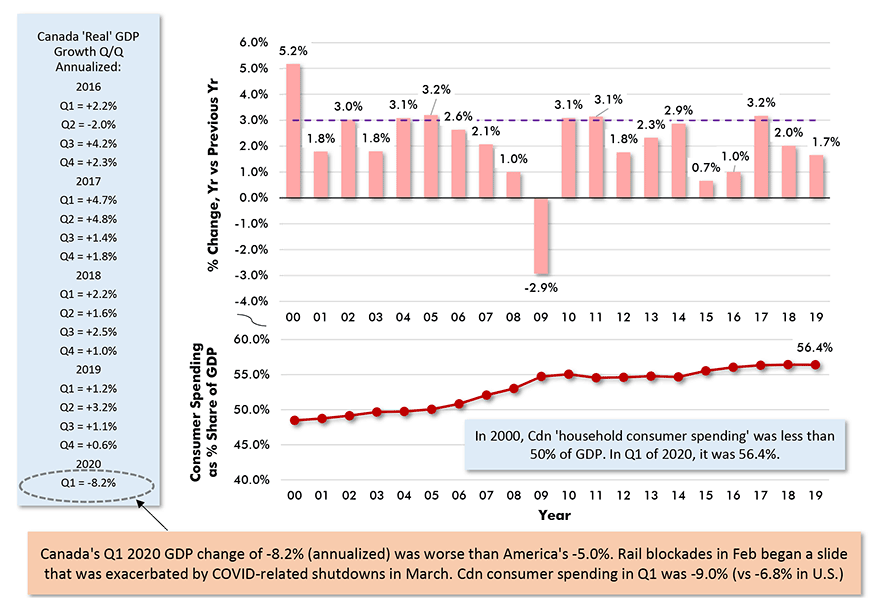
Canada in Q1 of this year walked an even more obstacle-strewn path than America. Canadian ‘real’ GDP change was -8.2%, q/q annualized. Consumer spending was -9.0%. Durable goods expenditures were -23.3%, but that depth of decline appears tame when compared with what happened in the semi-durable goods market (clothing, footwear and linen), -32.6% (in other words, down by a third).
Railway blockades in February, to protest construction of the Coastal Gaslink project in northern British Columbia, knocked Canada several steps backwards from the get-go. Then in March, government-directed ‘stay at home’ measures booted the economy the rest of the way down the stairs.

Chart: ConstructConnect.
U.S. Initial Jobless Claims Verge on Misleading
Be mentally prepared. For both the U.S. and Canada, the biggest bites out of GDP won’t be revealed until 2020’s second quarter results are released. And remember that, in real time, we have not yet escaped Q2.
Finally, there’s the data series that has delivered the most shocking returns of all in this downturn, U.S. initial jobless claims. In the eleventh week of extreme results, the figure was 1.9 million first-time unemployment insurance seekers.
For the nearly three months ending on May 30th, the cumulative total has been 42.6 million. This is becoming misleading, however. As people return to work, in dribs and drabs, they are not netted out of the over-40-million number.
Alex Carrick is Chief Economist for ConstructConnect. He has delivered presentations throughout North America on the U.S., Canadian and world construction outlooks. Mr. Carrick has been with the company since 1985. Links to his numerous articles are featured on Twitter @ConstructConnx, which has 50,000 followers.


Recent Comments
comments for this post are closed