U.S. Equilibrium vs Long-term Average
Graph 1, pictured below, is interactive. Unit starts, U.S. and Canada, will appear in a callbox as you run your cursor across the screen. Also, clicking on the selections in the ‘slicer’ box entitled ‘Country’ will enable you to see each curve separately.
A figure of 1.6 million units annually is usually taken to be the ‘equilibrium’ level for U.S. housing starts ‒ i.e., the number needed to satisfy demand based on population growth and family formations.
But there’s another number that maybe has more relevance. The average of each month’s seasonally adjusted and annualized (SAAR) housing starts in the U.S. over the past 20 years has been 1.25 million units.
Graph 1 shows index values, where the index calculation is ‘actual’ housing starts in each month divided by the long-term average of 1.25 million units. The mathematical calculation produces results that move up and down around the number 1.0. U.S. results are the blue line.
Canada 200,000-unit ‘Norm’ and a Bigger Picture
For Canada, I’ve been fond of saying that both annual and SAAR monthly starts have fluctuated, with relatively minor variation, around 200,000 units for a decade.
But I’ve been missing the bigger picture. In fact, average monthly (annualized) housing starts in Canada have been 200,000 units for the past two decades. There was a little more variety in the ‘00’ years, with slightly better than ‘norm’ achieved early on, to be counterbalanced by a brief span of softness in the Great Recession.
Canada’s monthly ‘actual’ SAAR starts minus 200,000 appear in Graph 1 as the red line. For Canada, mostly minor variation around the number 1.0 is the thread that runs across the page.
There are several key takeaways from Graph 1. First, there has been a much greater amplitude for U.S. housing starts this century than for Canadian starts. Second, the under-performance of U.S. starts (i.e., relative to the figure 1.0) from 2008 through 2019 suggests there has been a considerable accumulation of pent-up demand for new housing in the U.S.
For Canada, Graph 1 says 200,000 units is a number that can be counted on long-term, with some caveats that I’ll come to further along.
Interactive Visual: Graph 1
Several Positives for Housing Starts
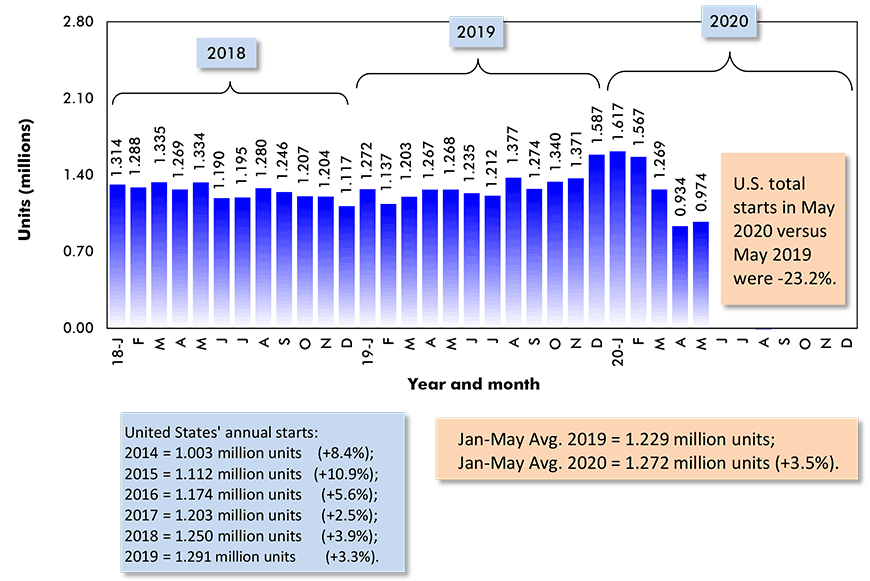
From Graph 2, there was a dip in U.S. housing starts in March of this year. The decline worsened in April and starts stayed weak in May. Massive layoffs and income reductions, and work interruptions at job sites, due to health concerns tied to the coronavirus outbreak, caused U.S. housing starts to stutter.
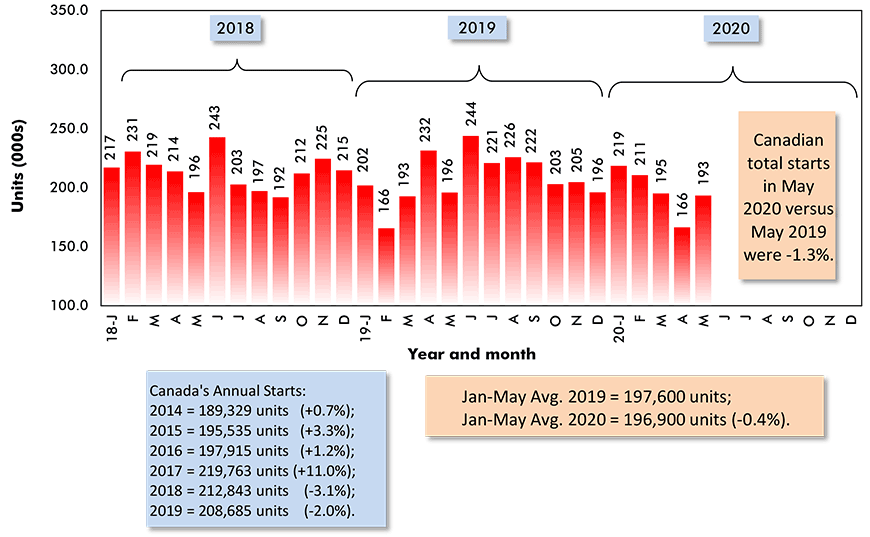
From Graph 3, Canadian housing starts fell sharply in April, but bounced back in May. April’s crater was primarily due to housing starts in the province of Quebec being reported as zero. For several weeks in April, almost all construction work in Quebec was placed on hold by government order. The restriction was lifted towards the end of the month.
Many analysts are basing their hopes for a strong revival in the economy on a quickly rebounding residential construction sector. In such an outlook scenario, ultra-low interest rates are viewed as being especially favorable.
Also, a shift in preference away from high-rise living ‒ i.e., with its prospect of virus-spread in ‘common rooms’ and elevators ‒ may accelerate a tendency already underway for newly-formed younger families (the millennial generation) to relocate to the suburbs.
But there’s also a compelling list of reasons to exercise caution in assessing the future for housing starts and they’ll be featured in the next section.
Graph 2: U.S. Monthly Housing Starts
Seasonally Adjusted at Annual Rates (SAAR)
Data source: U.S. Census Bureau (Department of Commerce).
Chart: ConstructConnect.
Graph 3: Canada Monthly Housing Starts
Seasonally Adjusted at Annual Rates (SAAR)
Data source: Canada Mortgage and Housing Corporation (CMHC).
Chart: ConstructConnect.
Graph 4: U.S. and Canada Monthly Housing Starts
Seasonally Adjusted at Annual Rates (SAAR)
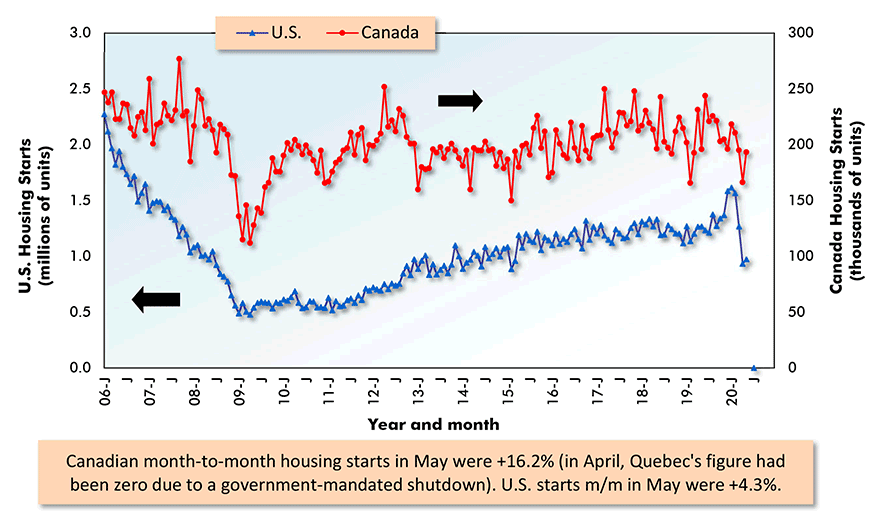
The last data points are for May, 2020.
ARROWS: U.S. numbers to be read from left axis; Canadian from right axis.
Data sources: U.S. Census Bureau & Canada Mortgage and Housing Corp (CMHC).
Chart: ConstructConnect.
But 5 Reasons to Scale Back New Home Expectations
There are at least 5 reasons for a cautious take on new housing construction.
(1) While the economy may be re-opening, there are still a great many individuals caught in an unemployment and reduced income jam. The number of people in the U.S. continuing to draw out-of-work insurance remains above 20 million. There are vast numbers beyond that, however, for whom pay reductions (e.g., from full-time to part-time work) have taken a toll. For them, thoughts of buying a new home are being sidelined by efforts merely to get by from week to week.
(2) One key offshoot from the pandemic is the validity it has lent to working from home. Business owners have noted that in many instances, home endeavors are yielding improved productivity. As a result, when looking to hire, the potential ‘pool’ is now greatly expanded. A worker on the West Coast can easily report to a boss on the East Coast, or vice versa. A similar situation prevails for many in the labor force who would like to try a more rural lifestyle. The employment possibilities are no longer as limited.
Historically, a heightened degree of mobility, to find work or to take on a new position, has been a defining characteristic of the American business scene. In recent years, this proclivity has been losing steam anyway. Now, it’s being tamped down even further.
(3) A surfeit of existing properties may soon be coming onto the marketplace, causing a glut in supply. Banks have been allowing monthly mortgage payments to slide, but that can go on only so long. A wave of residential property foreclosures seems inevitable. This may be even more of a problem in Canada than the U.S., since home purchase prices north of the border have been tracking higher for years.
What’s to become of condominium units bought for their investment potential, – i.e., to be rented out rather than lived in by the owner? In many cases, rents are being lowered just to keep tenants. Condos in the Airbnb space are facing a special dilemma. They rely for their income on visitors from out of town (e.g., tourists and business executives). Until a COVID-19 vaccine is readily available, the extent to which travel will recover ‒ especially given how effective video conferencing has become, ‒ will remain an open question.
(4) In both the U.S. and Canada, population growth has always been a prime driver of residential construction. Prior to the pandemic, Canada’s annual population gain (+1.5%) was beginning to far outstrip the U.S. rate of increase (+0.5%). Immigration, though, was accounting for four-fifths of Canada’s climb. While not as big a share of the total south of the border, it was still a major player in America’s overall population increase.
Immigration has now been curtailed, cutting into the need for new accommodations. On the far side of these extraordinary times, Canada will almost surely restore its immigration goals, although the time horizon may be stretched out. Residents of many poorer countries may be subjected to a prolonged coronavirus shock. The U.S. attitude towards a resumption of immigration awaits a political resolution.
(5) Many new and resale home purchasers over the past decade have been opting for ‘flexible’ mortgage rates, as opposed to ‘fixed’. With interest rates staying low for an extended time period, the ‘variable’ route has often proven cost effective.
But ‘variable’ may no longer be the advisable way to go (and old habits are hard to break). Governments have been spending enormous amounts and taking on previously unheard-of amounts of debt to save the economy. At some point, credit rating agencies will be stepping in and lowering ‘scores’. Then interest rates must rise. It will be the only means to secure bond financings. Variable mortgage rates will be caught in the updraft.
Graph 5: U.S. Total Monthly Housing Starts
Seasonally Adjusted at Annual Rates (SAAR)
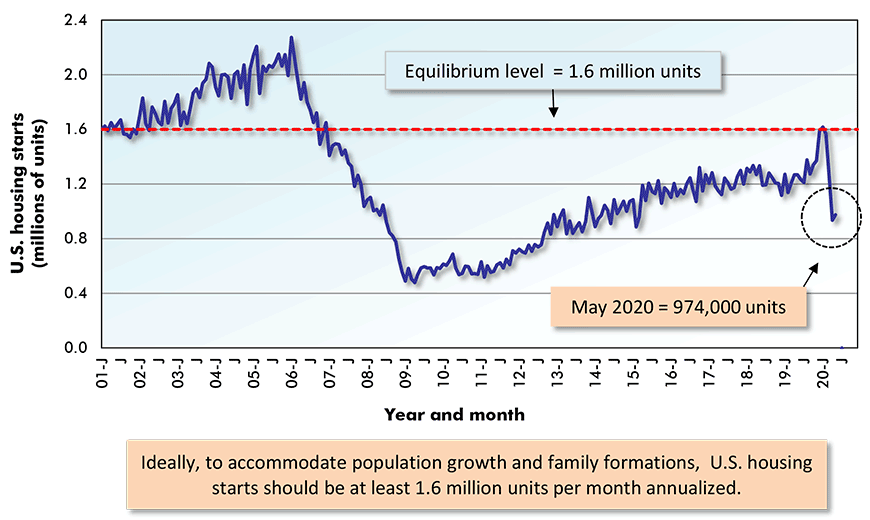
The last data point is for May, 2020.
Data source: U.S. Census Bureau (Department of Commerce).
Chart: ConstructConnect.
Graph 6: U.S. Monthly Residential Building Permits
Seasonally Adjusted at Annual Rates (SAAR)
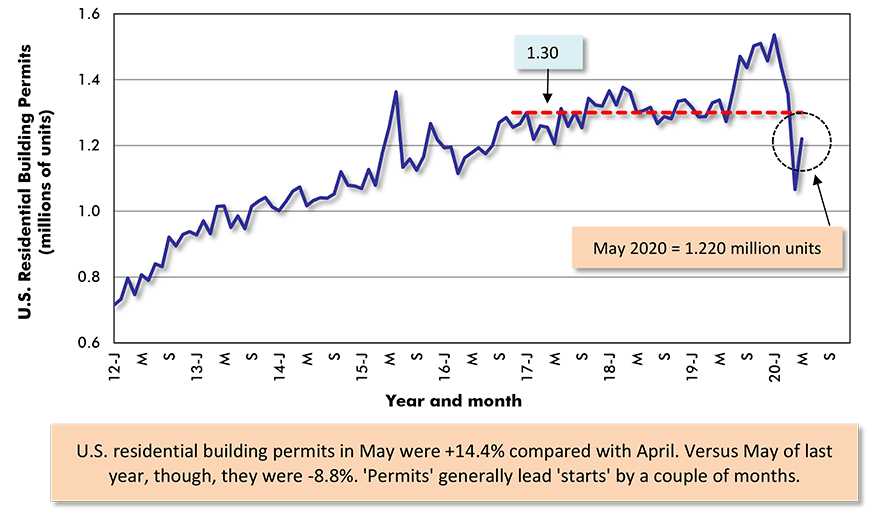
The last data points are for May, 2020.
Data source: U.S. Census Bureau (Department of Commerce).
Chart: ConstructConnect.
Graph 7: U.S. Regional Housing Starts
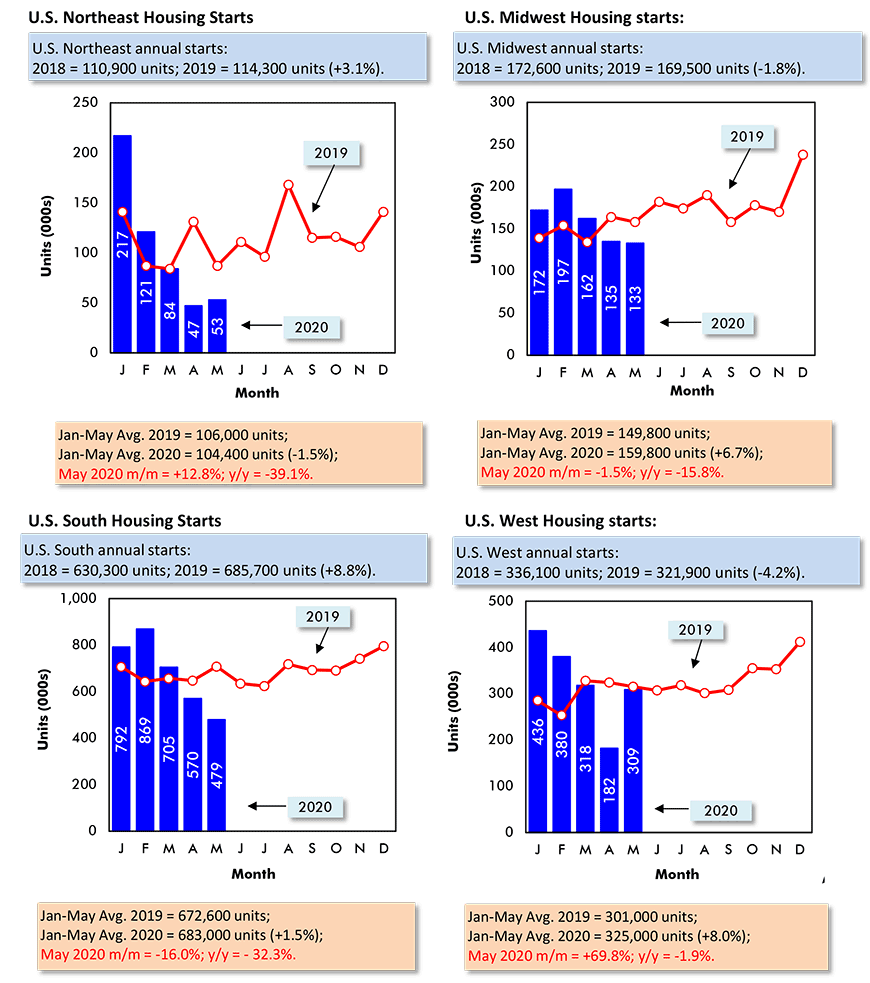
Data source: U.S. Census Bureau.
Chart: ConstructConnect.
Graph 8: U.S. Housing Starts
Jan-May 2020 vs Jan-May 2019 % Changes
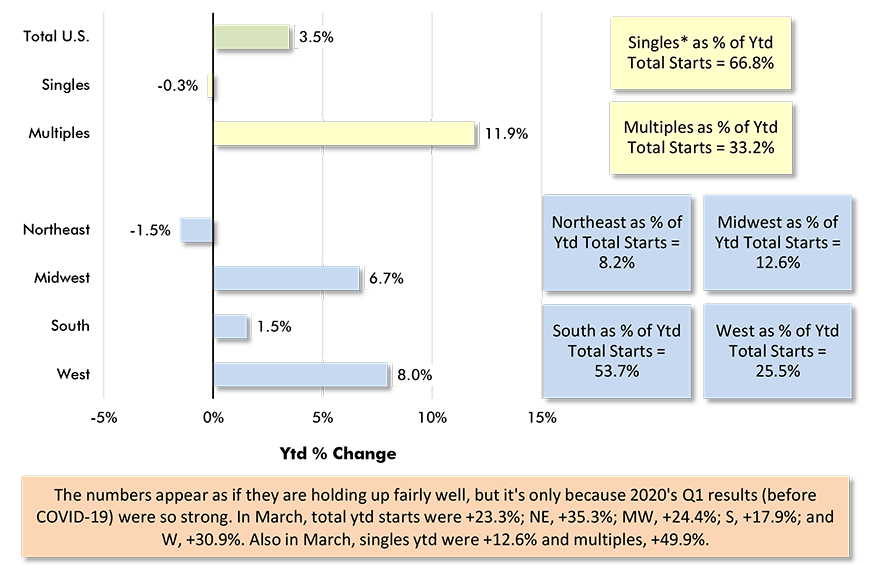
Based on averages of monthly seasonally adjusted and annualized (SAAR) unit starts.
* ‘Singles’ includes townhouse complexes, except when multiple units have common heating & air conditioning.
Data source: U.S. Census Bureau.
Chart: ConstructConnect.
Graph 9: Percent Change in Year-To-Date Housing Starts –
Ranking Of Canada’s Provinces
(Jan-May 2020 vs Jan-May 2019)
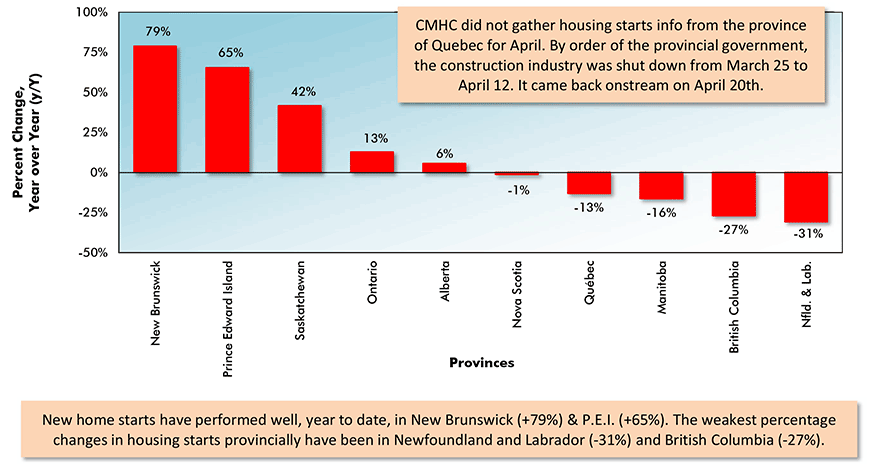
Data source: Canada Mortgage & Housing Corporation (CMHC) based on actuals rather than seasonally adjusted data.
Chart: ConstructConnect.
Graph 10: Percent Change in Year-To-Date Housing Starts –
Ranking Of Canada’s Major Cities
(Jan-May 2020 vs Jan-May 2019)
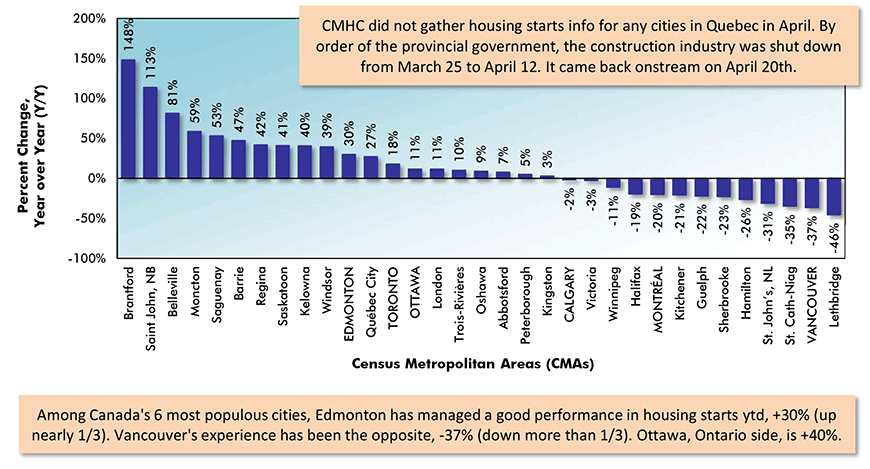
Canada’s Census Metropolitan Areas (CMAs) have core populations of 50,000 plus.
Canada’s 6 CMAs with populations in excess of 1 million are in capital letters.
Data source: Canada Mortgage & Housing Corporation (CMHC) based on actuals rather than seasonally adjusted data.
Chart: ConstructConnect.
Alex Carrick is Chief Economist for ConstructConnect. He has delivered presentations throughout North America on the U.S., Canadian and world construction outlooks. Mr. Carrick has been with the company since 1985. Links to his numerous articles are featured on Twitter @ConstructConnx, which has 50,000 followers.


Recent Comments
comments for this post are closed