U.S. GDP Bounce Back
After a change of -5.0% annualized in ‘real’ (inflation-adjusted) gross domestic product (GDP) in Q1 of this year, the U.S. economy plummeted -32.9% in Q2. Annualizing the number essentially means compounding the quarter-to-quarter change to obtain a yearly rate. (The result is usually close to multiplying by four.) The quarter-to-quarter change in Q2 was about -9.0%.
In Q3, there will be a big bounce back. A Q/Q increase of +7.0% to +8.0% will yield an outsized number for GDP growth approaching +30.0% annualized. This will inspire a lot of celebratory backslapping, but it will be deceptive and way too early to uncork the champagne.
September’s jobs numbers tell a truer story. The month-to-month increase in U.S. employment may have been an eye-popping +661,000, but it showed a third straight month of deceleration. The improvement in the labor market has been losing steam.
Graph 1: U.S.: Month-to-month Total Employment Change
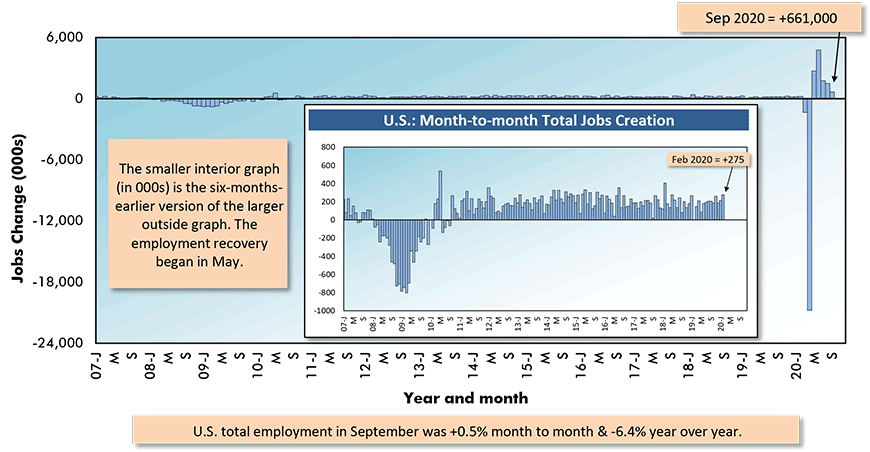
Chart: ConstructConnect.
Uneven Recovery
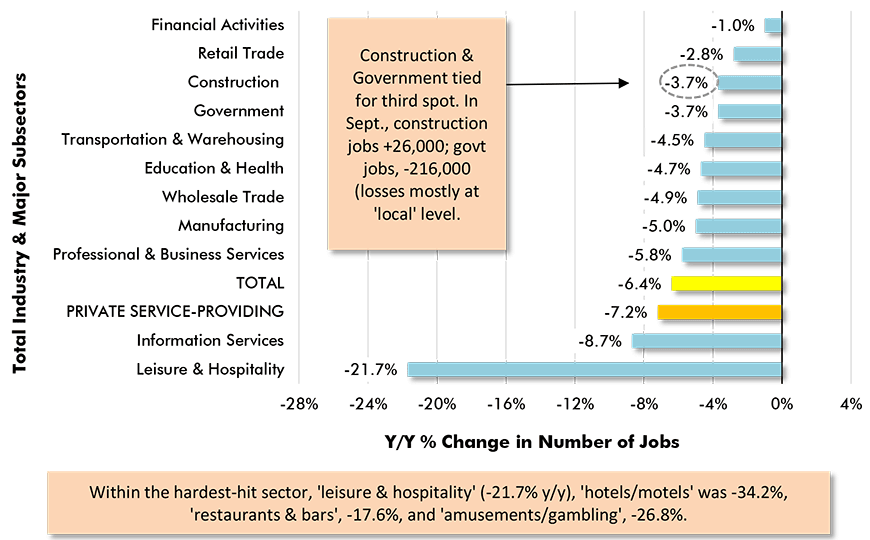
From February to April, due to the onset of the coronavirus health crisis, the U.S. economy shed more than 20 million jobs. As of September, fewer than half of those lost jobs have been recovered. Furthermore, the degree to which the recovery is occurring in uneven fashion has become starkly apparent. Employment in the hardest-hit sector, ‘leisure and hospitality’, is still down by more than one-fifth.
COVID-19 case counts are either level or increasing in about two-thirds of U.S. states. The re-openings of bars and restaurants that were possible in the summer, through adoption of such measures as outdoor patio seating, are now often being reconsidered. Fall weather is moving everyone indoors, where poorer air circulation promotes virus spread.
The airline sector is tumbling further. Security clearances at airports are down by 70%. United and American Airlines have recently announced combined layoffs amounting to 30,000 jobs. Tourism and business travel are far below normal. Disney Inc. is reducing employment at its theme parks by the tens of thousands.
Graph 2: Y/Y Jobs Change, U.S. Total Industry & Major Subsectors − September 2020 (based on seasonally adjusted payroll data)
Data source: Payroll Survey, U.S. Bureau of Labor Statistics (Dept of Labor)).
Chart: ConstructConnect.
The Stock Market is Not the Economy
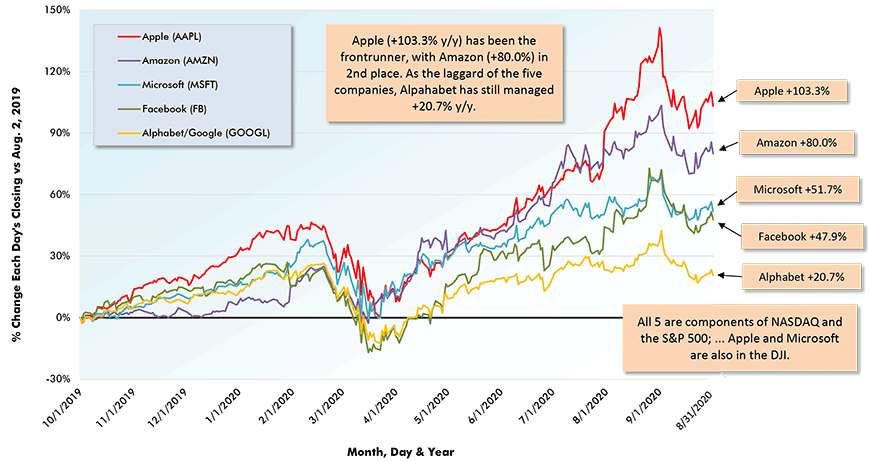
Much of the recent optimism concerning the economy has been coming from the stock markets. While there was some softening in equity prices in September, NASDAQ closed the month +39.6% year over year. The S&P 500 was also ahead by a good margin, +13.0% from a year ago. Dow Jones Industrials and the Toronto Stock Exchange were little changed.
The major stock market indices are being mainly driven by the FAAMG group of high-tech companies. The sum of their capitalizations comprise nearly 20% of the total market valuation of all U.S. stocks.
There can be no doubt that high-tech has come to the rescue of the economy through the pandemic. ‘Big Data’ management and video conferencing have saved the day for many corporations. But Zoom is now being valued by investors at a figure higher than the combined worth of America’s four largest airlines. Is that justified? Apparently, a lot of people think so.
Other worrisome anomalies appear in the stock market metrics. None of the FAAMG companies has a price/earnings ratio less than 32.0 (Table 1). The S&P 500 P/E has shot up to 28.9. A figure in a 15-to-20 range is normal. The stock market is walking its own path. It’s not the economy.
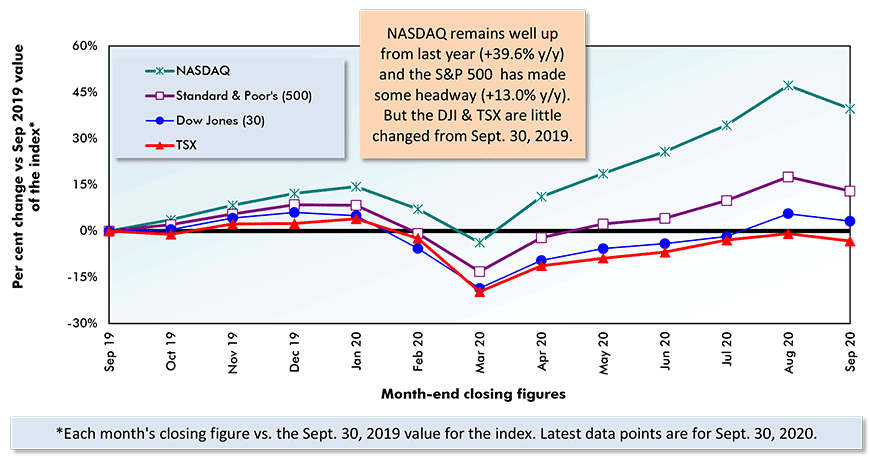
Securities Dealers Automated Quotations (NASDAQ), Toronto Stock Exchange (TSE) and Reuters.
(Each day’s closing value compared with Oct. 2, 2019 (i.e., year-ago) value)
 Data Sources: NYSE, Standard & Poor’s, NASDAQ, Reuters & Yahoo.
Chart: ConstructConnect.
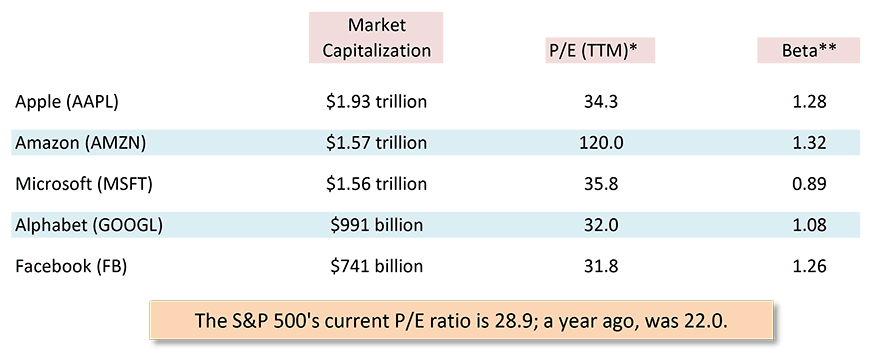
**Beta is a measure of volatility. A beta value is below 1.0 if a stock’s price moves less than the market.
Therefore, it’s supposedly less risky. Beta is calculated from the latest 60 months (i.e., 5 years).
Walmart has a beta value of 0.29; Tesla, 1.64.
Chart: ConstructConnect.
V-Shaped Recovery? Look to Retail Sales
U.S. retail sales have come roaring back. Retail is one corner of the economy where the hoped-for V-shaped recovery has made an appearance. Individuals still in possession of their jobs have seen their saving rates skyrocket. They haven’t been spending money on services such as restaurant meals and concert tickets. More money can go towards groceries and purchases over the Internet.
Digital retail sales have jumped by between 20% and 25% year over year. On the flip side, the space-occupation of ‘bricks and mortar’ retail has plunged. Also, the rents owing by many retailers are in arrears.
Some of the largest mall owners are combatting the rental-shortfall problem by taking equity stakes in their tenants. Also, efforts are underway to fill vacant square footage in previously unconventional ways. Car dealerships and medical clinics have been moving into shopping centers.
Retail construction, ‒ a category with a -30% decline in ‘actual’ starts to date in 2020 (i.e., through August, as calculated by ConstructConnect) ‒ will be hampered for a long while by the ‘overhang’ of emptied-out stores. Overhang will even have an impact on one bright spot for construction, the ‘warehouse’ sub-category.
Warehouse Construction Strong, but a Caveat
Thanks to groundbreakings on ultra-large distribution and fulfilment centers, warehouse starts through the first eight months of this year have almost stayed even with last year, -2.7%. (Staying level y/y is a huge accomplishment, given that most type-of-structure categories have dropped by at least one-fifth.)
There’s a move afoot to locate smaller distribution centers closer to customers. City officials want to boast about residents having access to nearly everything within a minimal time frame (e.g., Paris, France, is aiming to become a ’15-minute’ city). This effect is likely to mute new smaller warehouse construction, as owners will have the option of moving into previously occupied, but now vacated, retail space.
Also be aware that retail activity, while displaying strength presently, is set for a new hard knock as many workers at the low end of the earnings spectrum see their purchasing potential reduced. Government income supplement programs have run out and Congress has been unable to compromise on new initiatives.
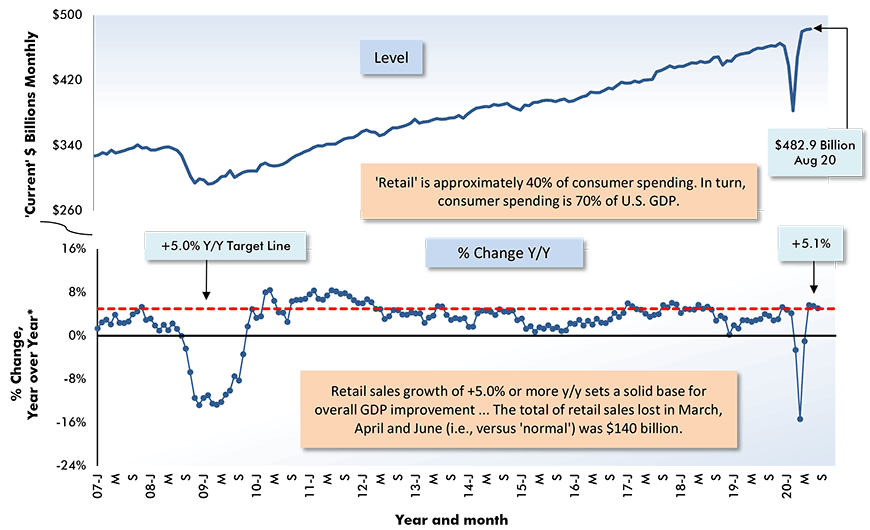
Adjusted for seasonality and trading day differences, but not for price changes (i.e., figures are in ‘current’ dollars).
Chart: ConstructConnect.
Educational & Medical Care Starts
A bellwether for how well the economy will be able to perform in the remainder of this year will be found in school re-openings. Understanding that there are 14-day incubation periods to factor in, are students and teachers currently escaping with minimal risk to their health? If the answer is ‘yes’, then the prospects for a solid pickup in economic affairs improves considerably. Parents won’t have to think about staying home to watch over their children.
If the answer is ‘no’, then confidence will take a beating. As for school construction, though, there are impediments. Chief among these are drops in enrolment, particularly at the level of higher education, caused by online learning, and exacerbated by fewer foreign students. By the way, ‘educational facilities’ is the largest sub-category among all nonresidential building starts.
In the field of health care, starts are currently off by nearly half compared with January-to-August of last year. But this is a category of construction where pent-up demand will play an important role post-pandemic. Normal visits to the doctor and many elective surgeries are being postponed in favor of dealing with COVID-19 as the top priority. Eventually, after reliable vaccines have been developed and disseminated, the dam will burst on the demand for traditional medical procedures.
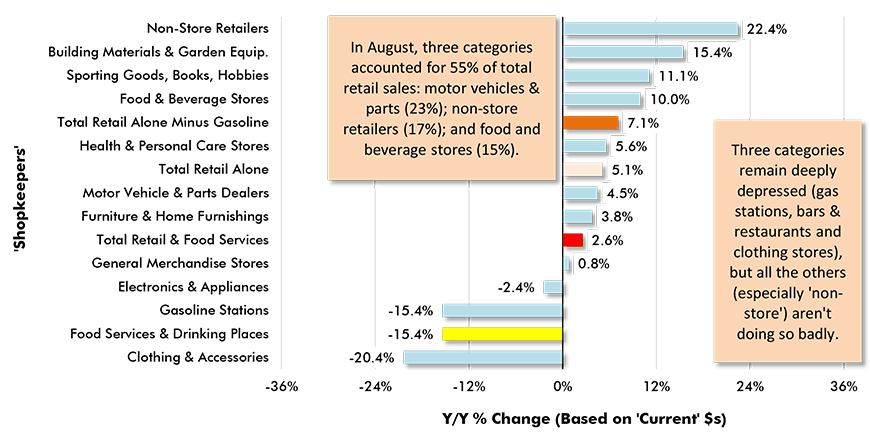
Chart: ConstructConnect.
A Pendulum in Office Tower Occupancies
The downtown office-tower cores of the nation’s major cities continue to be pale copies of what they used to be. Employees that formerly crowded into elevators to reach the 20th, 30th or 50th floor are now working from home. The more tech-savvy the company, the more working remotely has been proven viable.
The pendulum won’t stay stuck in its outer arc forever. Collaboration on team projects is easier when co-workers can get together. And there are some surprising reasons to favor physical proximity. Ambitious personnel, looking to climb the corporate ladder, prefer proximity to their bosses. And the training of new staff is more of a challenge when one can’t simply ‘look over a shoulder’.
A move back towards ‘old-time’ commuting and sitting at a corporate desk is already being led by real estate development firms and energy companies. It’s mildly amusing to note, however, that those two sectors have a vested interest in seeing their workers ensconced in their usual seats. More likely will be the establishment of hybrid office work, with departments and employees on staggered shifts. The outlook for office space construction will remain uncertain, at best, for a couple of years.
Mobility & Climate Change Issues in Residential Markets
Ultra-low interest rates and increased mobility ‒ i.e., from urban ‘cores’ to suburbs and rural areas ‒ arising from the pandemic have lifted the outlook for single-family residential construction. Plus, the heightened national savings rate (to 18% from a ‘usual’ 8% or less) has facilitated the accumulation of down payments.
The mobility increase hasn’t been entirely due to the ‘social distancing’ brought on by the health crisis. The possibility of a pandemic has long been a subject of speculation. Nevertheless, its actual appearance caught nearly everyone by surprise.
A similar turn of events certainly seems possible concerning climate change. Real estate firms are beginning to record ‘flood risk’ in their residential property listings. Insurance companies are denying coverage (although government legislation is working to stop this practice) to homeowners most susceptible to wildfire outbreaks.
Sea-level coastal living, with the frequency of hurricanes necessitating a dip into the Greek alphabet for names, is losing appeal relative to interior communities.
Seasonally Adjusted at Annual Rates (SAAR)
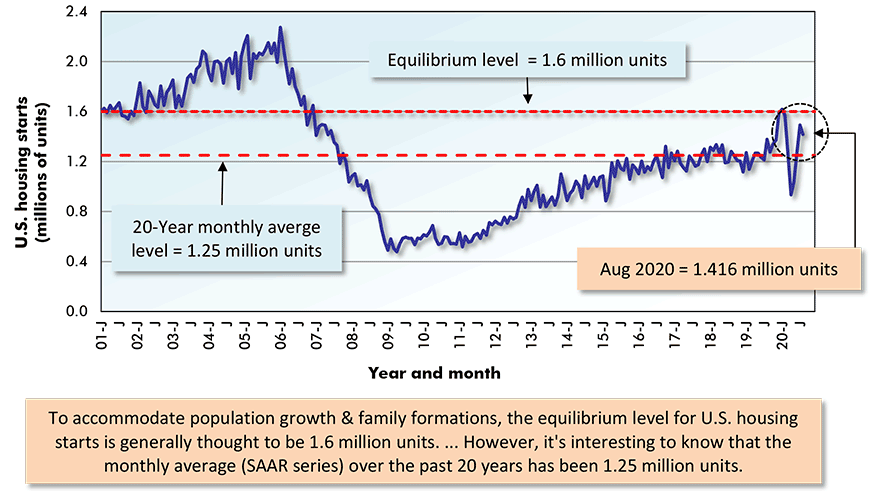
Chart: ConstructConnect.
Seasonally Adjusted at Annual Rates (SAAR)
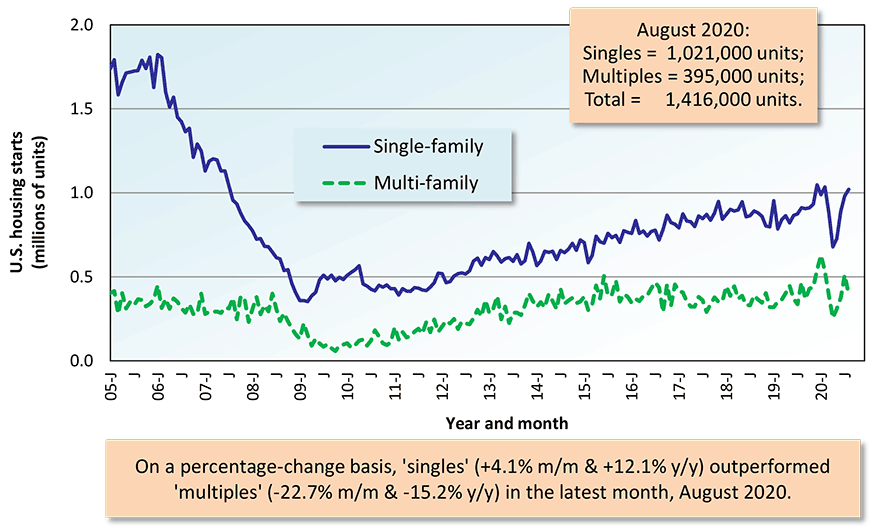
Chart: ConstructConnect.
Roadbuilding & Manufacturing
More single-family housing implies support for roadbuilding. ConstructConnect’s ‘roadwork starts’ is the other sub-category of total starts (along with warehouses) that has held up relatively well year to date, -2.8%.
The Fixing America’s Surface Transportation (FAST) Act has brought stability to the financing of roadbuilding over the past five years, but it expired on September 30th. A one-year extension is expected. The federal gasoline (and diesel) taxes employed to take in revenue have not changed in decades. State gasoline taxes, on the other hand, have been (and are continuing to be) adjusted upwards.
Deglobalization is being counted on to spur a resurgence in manufacturing construction. This may come to pass, but investment in the sector is currently being inhibited by low capacity utilization rates. Plant usage for manufacturing has now improved to 70% from 60% in the spring, when COVID-19 idled many production-line operations. But the figure needs to be above 80% before capital expenditures on new footprints will be unleashed.
There are a couple of categories of mega projects (carrying estimated values of $1 billion or more each) under the ‘manufacturing’ umbrella ‒ LNG plants and chemical/petrochemical plants. The environmental movement is increasingly turning its attention to the harmful side effects of too much non-degradable plastic ‘floating around’, both on land and in the sea.
Engineering is the Principal Home of Mega Projects
Engineering construction is where many of the ‘mega projects’ are normally to be found. Prior to the pandemic, the upcoming mega projects inventory included a vast array of airport expansion and rapid transit plans. The former are sure to suffer some setbacks while air traffic struggles to regain even a modicum of its former glory.
The latter, driven by commuter traffic that has diminished, and paid for with public funds that were sent into disarray earlier this year by sales and property tax declines, would also seem open to a spate of postponements.
Two Other Ingredients in the Economic Stew
Finally, there are two other factors that are important in assessing what the future might bring.
First, and especially due to cutbacks in immigration, population growth has slowed to a trickle. As an axiom, ‘more people’ means more spending and a greater need for living quarters and all manner of commercial and institutional supporting structures.
Second, the Federal Reserve insists it will keep nominal interest rates near zero for years, out to 2023. But won’t debt rating agencies have a say? They’re already taking action to downgrade some public sector debt.
Also, to finance the ongoing ‘goods’ foreign trade deficit, which is approaching $1 trillion, a yield hike may be needed to keep the value of the U.S. dollar from sliding in unseemly fashion.
Forecasts versus Actuals
ConstructConnect will be conducting another of its quarterly starts forecast reviews in October. As matters currently stand, the previous projection called for ‘grand total’ starts in 2020 versus 2019 to be -21.3%. ‘Actual’ grand total starts through August have been -20.4%.
The heavy engineering/civil category has been especially close to target; a forecast of -12.4% compared with a year-to-date actual change of -12.9%. ‘Nonresidential building’ has been -29.7% as a projection versus -34.4% as an ‘actual’; residential, -17.4% next to -7.9%.
For 2021 relative to 2020, the starts forecasts as they currently stand are: residential, +7.7%; nonresidential building, +10.8%; engineering, +10.8%; and ‘grand total’, +9.6%.
The 2021/2020 percentage increases are on top of a low base (i.e., the 2020 denominator in the percentage change calculation has had the stuffing kicked out of it by the pandemic.) I suspect the most likely change we’ll be making will be to raise the residential gain somewhat.
Alex Carrick is Chief Economist for ConstructConnect. He has delivered presentations throughout North America on the U.S., Canadian and world construction outlooks. Mr. Carrick has been with the company since 1985. Links to his numerous articles are featured on Twitter @ConstructConnx, which has 50,000 followers.









Recent Comments
comments for this post are closed