
When presenting housing starts for the U.S. and Canada, the Census Bureau and CMHC first seasonally adjust monthly ‘actual’ units and then annualize them, to arrive at what are termed SAAR (seasonally adjusted and annualized) figures. ‘Annualizing’ takes the monthly number and projects it out over 12 months.

The January-April average of the four monthly SAAR figures for the U.S. so far this year is 1.594 million units, +18.2% when compared with January-April 2020’s average. Since the Fall of last year, a mini new housing construction boom has been underway in America.
Canada’s January-April average of monthly SAAR starts has been 295,700 units, +50.5% versus the comparable average managed in the first four months of last year. In Canada, the boom in residential groundbreakings isn’t speaking tentatively, rather it’s shouting.
Graph 1: U.S. Monthly Housing Starts
Seasonally Adjusted at Annual Rates (SAAR)
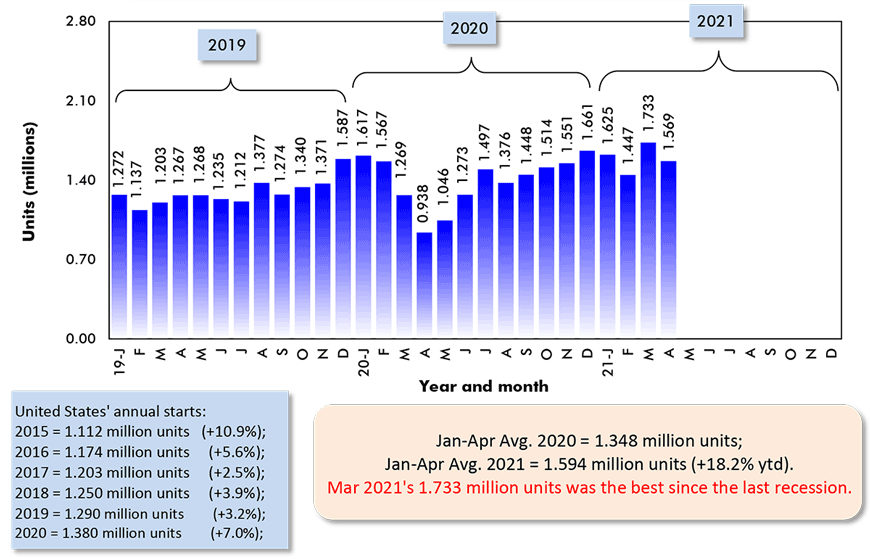
Data source: U.S. Census Bureau (Department of Commerce).
Chart: ConstructConnect.
Graph 2: Canada Monthly Housing Starts
Seasonally Adjusted at Annual Rates (SAAR)
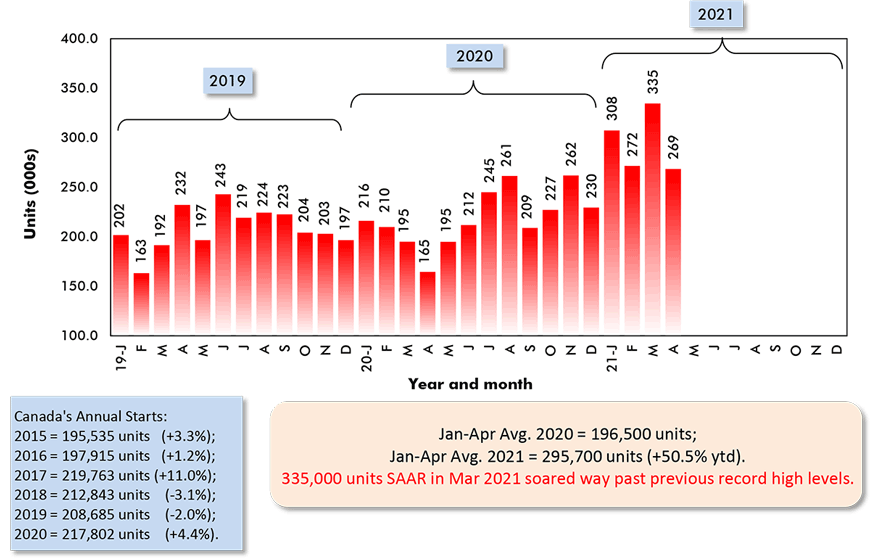
Data source: Canada Mortgage and Housing Corporation (CMHC).
Chart: ConstructConnect.
The Singles vs Multis Split
A major difference between U.S. and Canadian housing starts is to be found in the relative shares of single-family starts versus multi-family starts. As Graph 3 shows, singles as a share of U.S. total housing starts are usually around 70%. They currently claim a 71.4% slice. At the tail end of the 2008-09 recession, they rose as high as 90%.
In Canada, the relationship is reversed. Multis account for the bigger proportion. Year to date in 2021, among Canada’s 35 census metropolitan areas (CMAs), multis comprise 77.9% of the total, with singles at only 22.1%.
In Canada’s three largest population centers, multis are an even bigger part of the total. In Toronto, the pie wedge is 84.6%; in Vancouver, 89.1%; and in Montreal, 91.3%.
Graph 3: U.S. Single-Family & Multi-Family Monthly Housing Starts
Seasonally Adjusted at Annual Rates (SAAR)
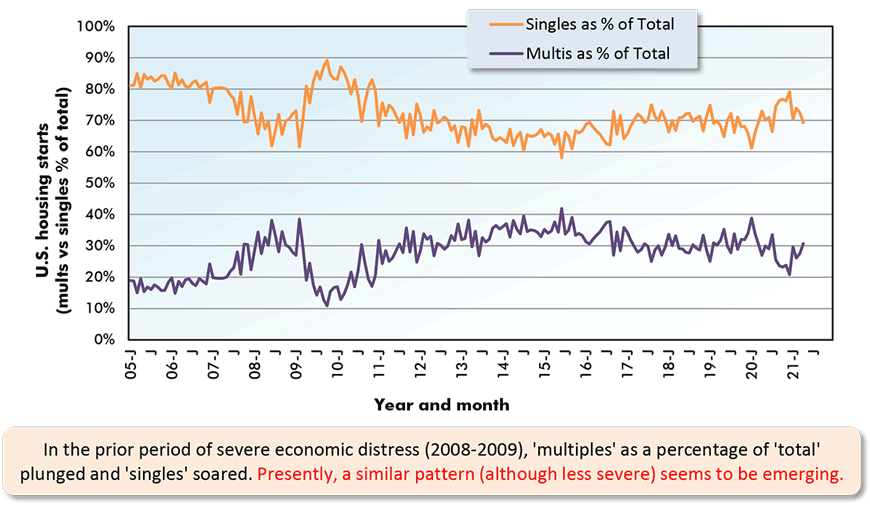
The last data points are for April 2021.
Data source: U.S. Census Bureau (Department of Commerce).
Chart: ConstructConnect.
What do Permits Say?
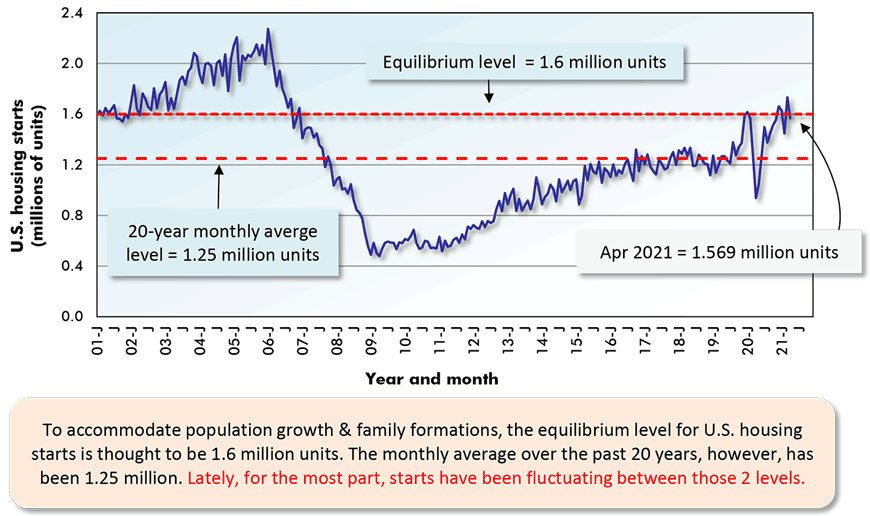
From Graph 4, U.S. housing starts have finally climbed back to 1.6 million units SAAR on a consistent basis. But that’s not keeping up with the pace of permits, which is close to 1.8 million units, as set out in Graph 5. The high number of permits indicates that there will be ongoing strength in U.S. new home starts for at least a while.
This argument receives further support from Graph 6, which plots the rolling-forward latest 12-month sums of the differences between permits and starts, both as ‘actuals’. Over the past three months, the permits-to-starts differentials have soared to their highest positions in six years.
Graph 4: U.S. Total Monthly Housing Starts
Seasonally Adjusted at Annual Rates (SAAR)
The last data points are for April 2021.
Data source: U.S. Census Bureau (Department of Commerce).
Chart: ConstructConnect.
Graph 5: U.S. Monthly Residential Building Permits
Seasonally Adjusted at Annual Rates (SAAR)
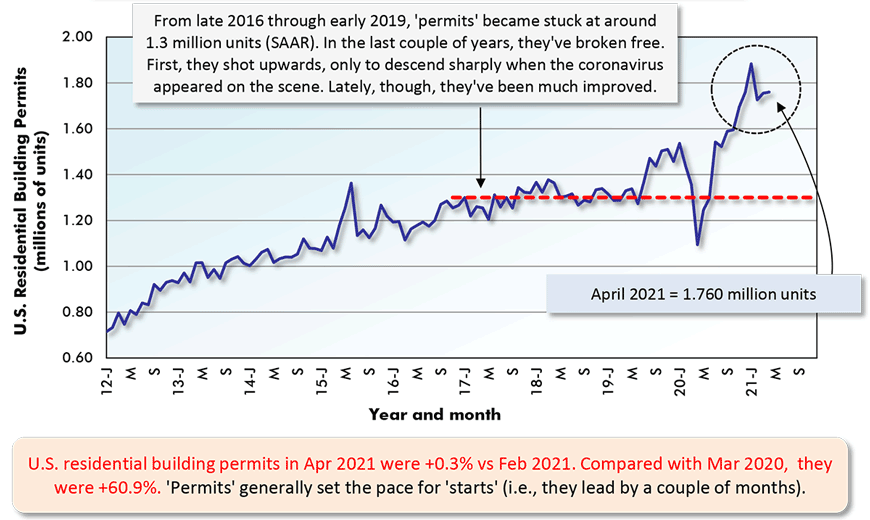
The last data point is for April 2021.
Data source: U.S. Census Bureau (Department of Commerce).
Chart: ConstructConnect.
Net Figure of Latest 12-Month Sums (in Units), Total U.S.
(From Not Seasonally Adjusted/NSA Actuals)
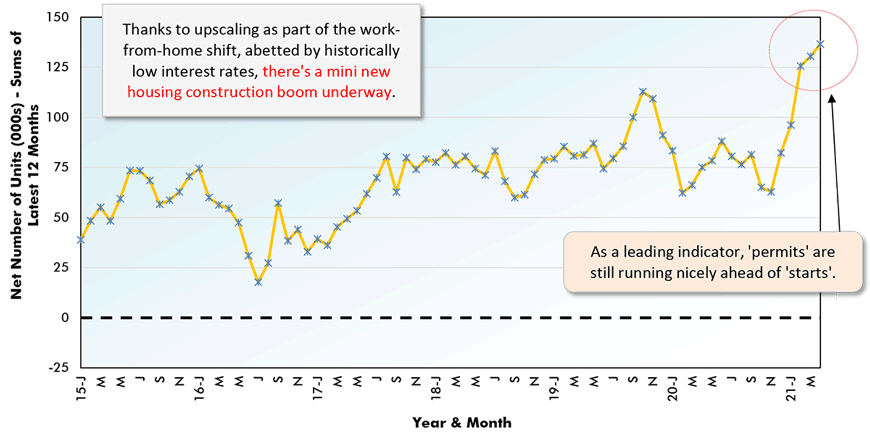
Chart: ConstructConnect.
It’s the South and West over the Northeast and Midwest
From Graph 7, the region with the greatest percentage increase in starts to date this year has been the Northeast, +37.1%, followed by the Midwest, +24.9%, and the West, +21.5%. The South has also seen a gain, but of a less stellar amount, +12.2%.
Graphs 9 and 10, however, are interesting because they show the relative performances of the regions over a longer time frame. To make the comparisons easier, they adopt an index approach.
In Graph 9, the year 2000 is the base. The 2000 level is set equal to 100.0. Annual levels for each series after 2000 are divided by the level in 2000 and multiplied by 100.
All the regions had steep drops through 2009, but they’ve recovered nicely since. Only the South Region, though, in 2020 managed a level of housing starts greater than in 2000.
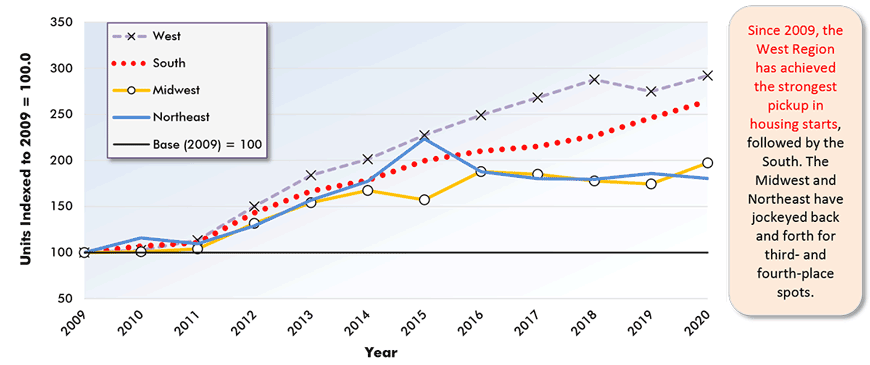
From Graph 10, which also employs index values, but adopts a 2009 base, it’s the West showing the greatest improvement over the last ten years, followed by the South, with the Midwest and Northeast skirmishing over third and fourth spots.
Graph 7: U.S. Regional Housing Starts (SAAR) – April 2021
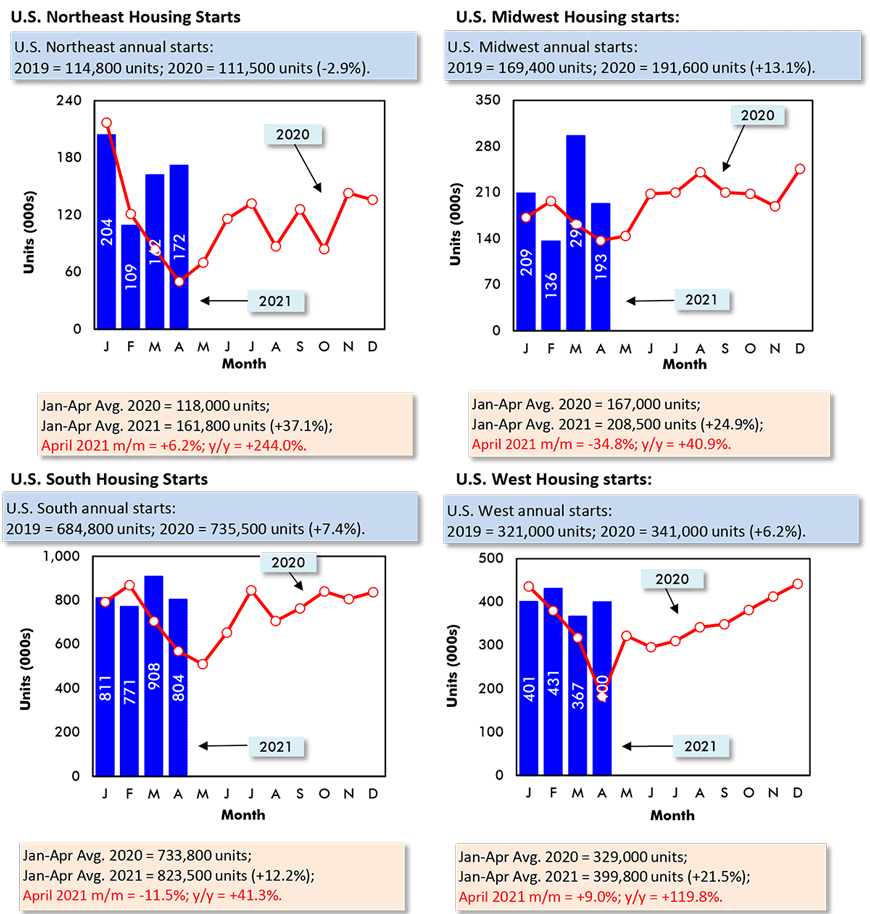
Data source: U.S. Census Bureau (Department of Commerce).
Chart: ConstructConnect.
Graph 8: U.S. Housing Starts
Jan-Apr 2021 vs Jan-Apr 2020 % Changes
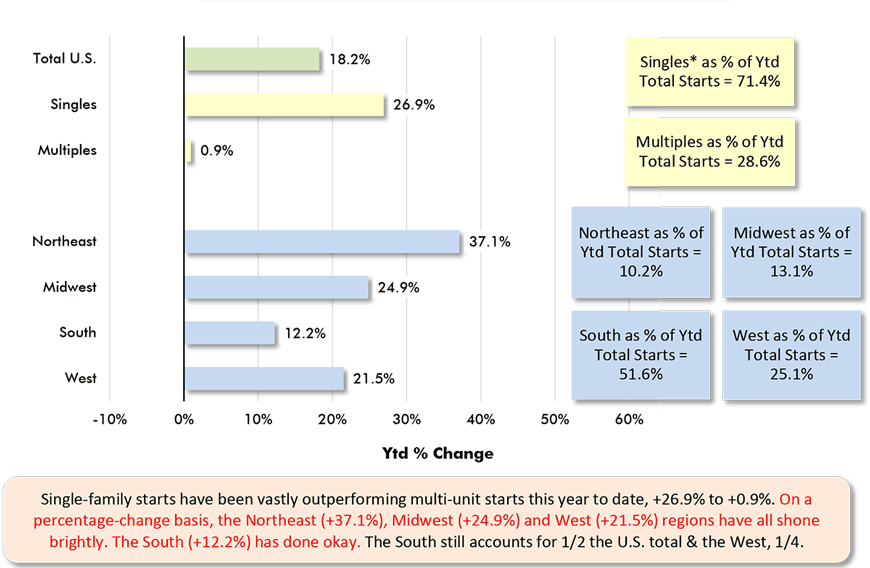
Based on averages of monthly seasonally adjusted and annualized (SAAR) unit starts.
* ‘Singles’ includes townhouse complexes, except when multiple units have common heating & air conditioning.
Data source: U.S. Census Bureau.
Chart: ConstructConnect.
Graph 9: Housing Starts in U.S. Regions Since the Turn of the Century (i.e., 2000) Indexed
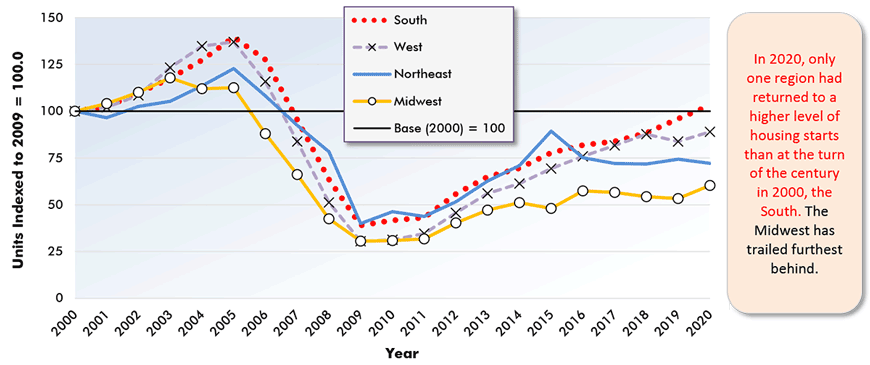
The index approach, which makes comparisons easier: The annual level for each index in each year is divided by the same index’s annual level in 2000 (multiplied by 100 to vary relative to the ‘base’ set = 100).
Data source: U.S. Census Bureau (Department of Commerce.
Chart: ConstructConnect.
Graph 10: Housing Starts in U.S. Regions Since End of the Previous Recession (i.e., 2009) Indexed
The index approach, which makes comparisons easier: The annual level for each index in each year is divided by the same index’s annual level in 2000 (multiplied by 100 to vary relative to the ‘base’ set = 100).
Data source: U.S. Census Bureau (Department of Commerce.
Chart: ConstructConnect.
Canadian Starts Way Above Average
As set out in Graph 11, near the end of 2019 and in the early stages of 2020, U.S. new home starts were signaling that, on a population-adjusted basis, they were about to catch up with and overtake Canadian starts.
But a funny thing happened. Suddenly, Canadian housing starts launched into orbit. On a SAAR’s basis, their national levels this year to date have been: 308,000 units in January; 272,000 in February; 335,000 in March; and 269,000 in April.
To understand how startling those numbers are, consider that the Canadian monthly average for twenty years from 2000 to 2019, with population growth exploding mainly due to immigration (which has been much quieter of late, due to coronavirus-driven border closures), was 200,000 units.
March 2021’s level of 335,000 was two-thirds higher than average and one-fifth above the previous record peak.
Graph 11: U.S. and Canada Monthly Housing Starts
Seasonally Adjusted at Annual Rates (SAAR)
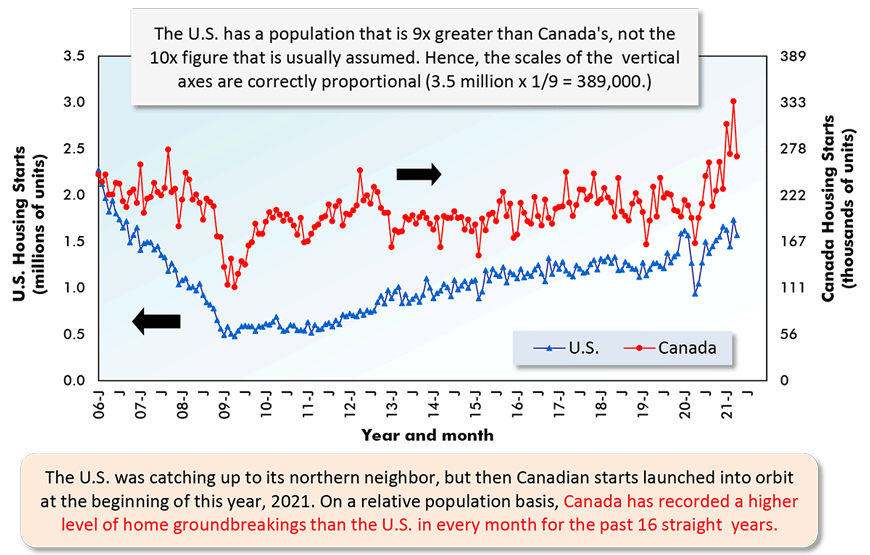
The last data points are for April 2021.
ARROWS: U.S. numbers to be read from left axis; Canadian from right axis.
Data sources: U.S. Census Bureau & Canada Mortgage and Housing Corp (CMHC).
Chart: ConstructConnect.
Graph 12: Percent Change in Year-To-Date Housing Starts –
Ranking Of Canada’s Provinces
(Jan-Apr 2021 vs Jan-Apr 2020)
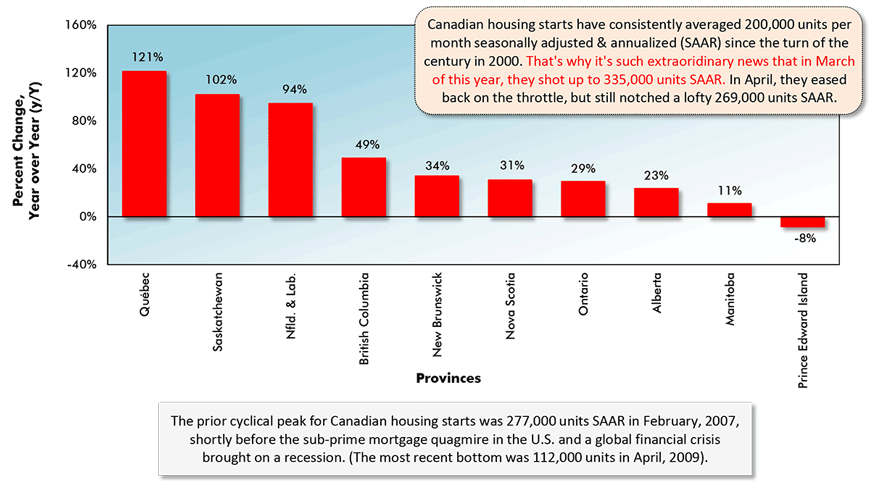
Data source: Canada Mortgage & Housing Corporation (CMHC) based on actuals rather than seasonally adjusted data.
Chart: ConstructConnect.
Graph 13: Percent Change in Year-To-Date Housing Starts –
Ranking Of Canada’s Major Cities
(Jan-Apr 2021 vs Jan-Apr 2020)
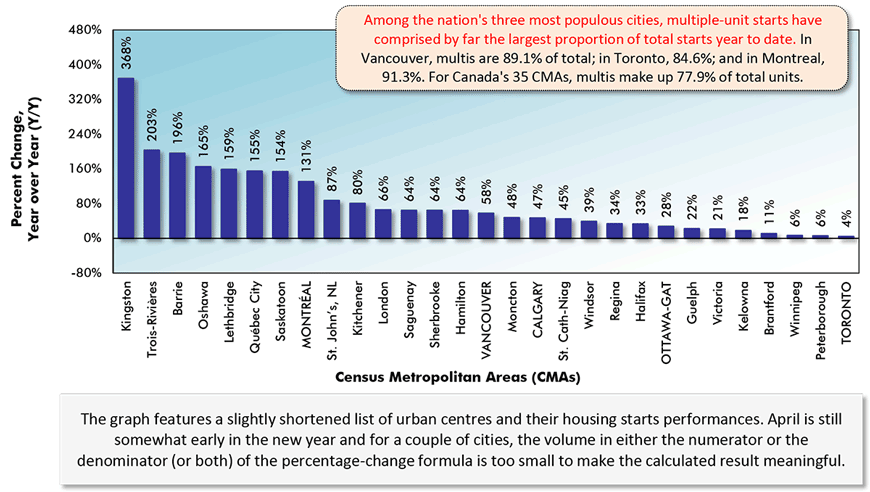
Canada’s Census Metropolitan Areas (CMAs) have core populations of 50,000 plus.
Canada’s 6 CMAs with populations in excess of 1 million are in capital letters.
Data source: Canada Mortgage & Housing Corporation (CMHC) based on actuals rather than seasonally adjusted data.
Chart: ConstructConnect.
Montreal Hottest Among Hot Spots
Among Canada’s most populous cities, Toronto usually leads the way in starts, but in some of the key metrics, TO’s first-place ranking is currently being usurped by Montreal.
With respect to ytd levels of housing starts, from Graph 14, Toronto is first in singles, but second to Montreal in multiples. Toronto still claims top spot for ‘total’, but Montreal isn’t far behind.
When it comes to ytd percentage-change in starts (Graph 15), however, Montreal is the frontrunner in all three categories, ‘singles’ (+201%); ‘multis’ (+126%); and ‘total’ (+131%). In fact, Montreal has achieved a more than doubling in all three instances.
But there’s an easy-to-understand explanation. In the Spring of last year, construction sites in Quebec were shut down for about a month due to uncertainty related to COVID-19’s spread. April 2020’s official count of housing starts in the province was zero. Therefore, the Jan-Apr 2021 year-to-date comparison is really versus the truncated time frame, Jan-Mar 2020.
Vancouver’s ytd total starts are +58% and Ottawa-Gatineau’s, +28%. In the province of Alberta, Calgary (+47%) is beating Edmonton (+1%).
Graph 14: Housing Starts in Canada’s 6 Most Populous Cities
January to April 2021 Actuals
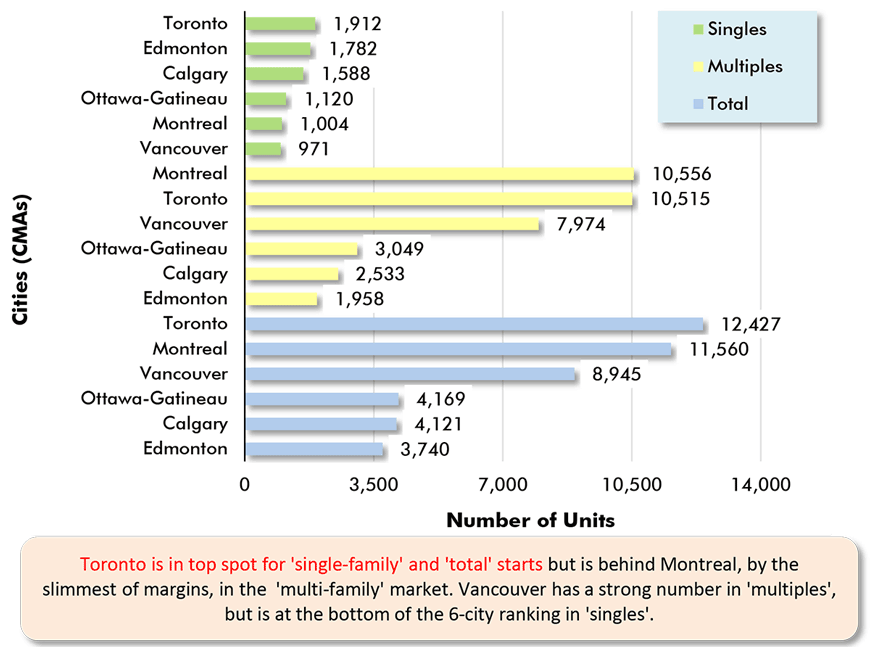
Data source: Canada Mortgage & Housing Corporation (CMHC).
Chart: ConstructConnect.
Graph 15: Housing Starts in Canada’s 6 Most Populous Cities
Jan-Apr 2021 vs Jan-Apr 2020
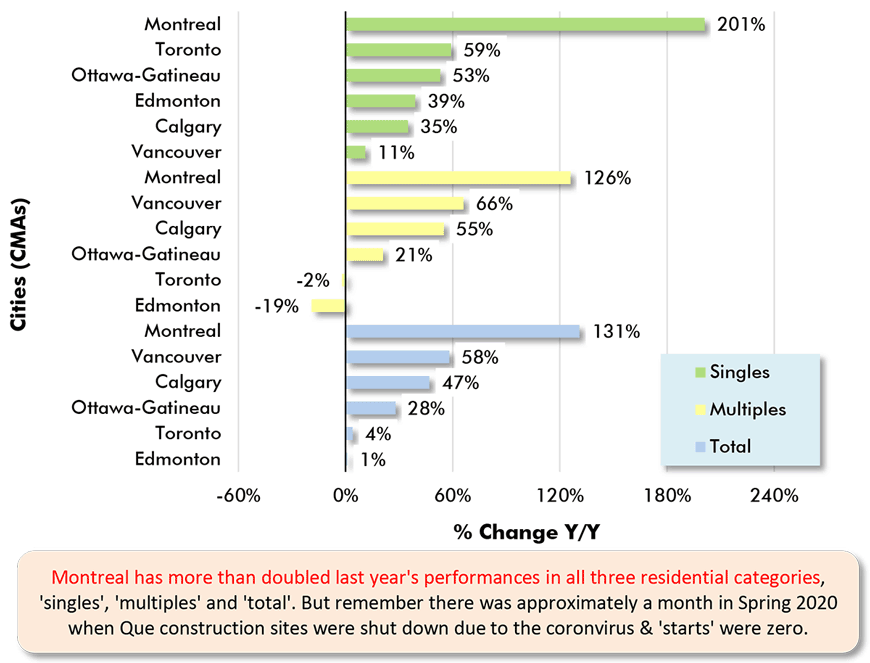
Data source: Canada Mortgage & Housing Corporation (CMHC).
Chart: ConstructConnect.
Please click on the following link to download the PDF version of this article:
Economy at a Glance Vol. 17, Issue 76, 77, 78 & 79 – Booms in U.S. & Canadian Housing: One Tentative, the Other Boisterous – PDF
Alex Carrick is Chief Economist for ConstructConnect. He has delivered presentations throughout North America on the U.S., Canadian and world construction outlooks. Mr. Carrick has been with the company since 1985. Links to his numerous articles are featured on Twitter @ConstructConnx, which has 50,000 followers.


Recent Comments
comments for this post are closed