
Initial Jobless Claims and UI on Right Track
This article features a quick overview of the latest key statistics for the U.S. and Canadian economies, presented mainly in graph form. For starters, U.S. initial jobless claims have finally dropped to a reasonable level, just above 400,000 for the week ending May 22nd.

Prior to the pandemic, with the economy chugging along near full speed, initial jobless claims consistently sat between 200,000 and 300,000.
Therefore, once they fall below 300,000 again, there’ll be good reason to believe that a true return to ‘normal’ has been achieved.
The number of individuals receiving unemployment insurance is also trending down in a positive way. The latest weekly figure was 3.642 million, a falloff of nearly -100,000. In the best of times, the number is shy of two million.
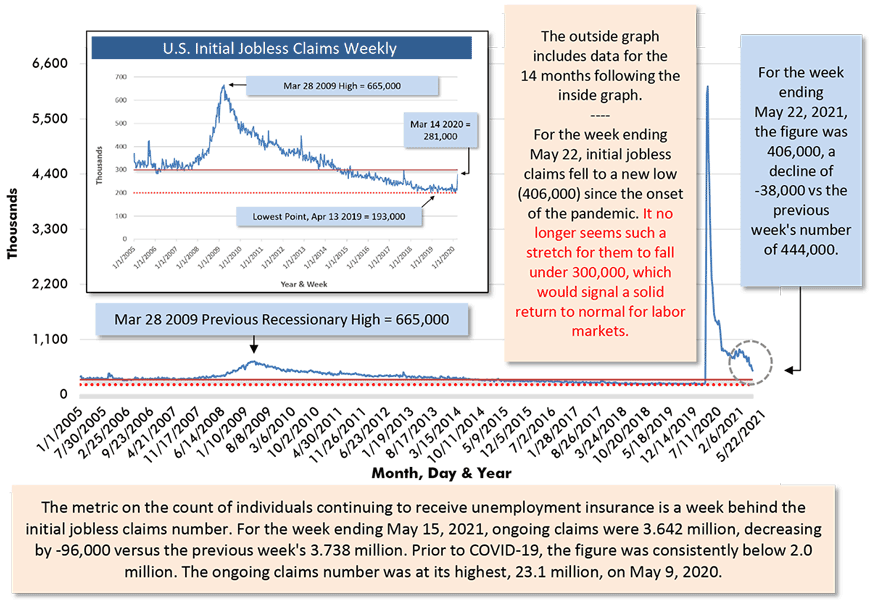
Chart: ConstructConnect.
Inflation Comes out of Hibernation
As nearly everyone has been saying (or expecting), inflation in the U.S. and Canada is now raising its head again.
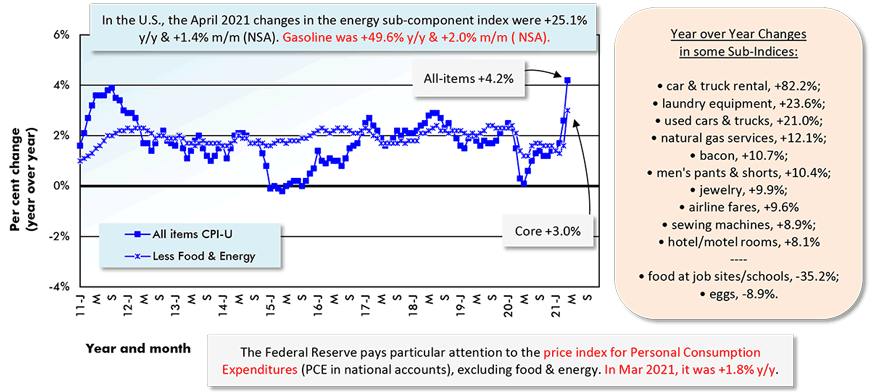
In April, the U.S. all-items Consumer Price Index (CPI) jumped to +4.2% year over year from +2.6% in March. The text box in Graph 2 lays out where the major price spikes have occurred. For example, car or truck rental is currently +82.2% more expensive than at this time last year.
Used cars and trucks have gone up +21.0% in price y/y. Laundry equipment is +23.6% y/y.
The cost of bacon is +10.7% y/y. But if you love a traditional all-day breakfast, that’s okay because the price of eggs in the U.S. is down to almost the same degree, -8.9% y/y.
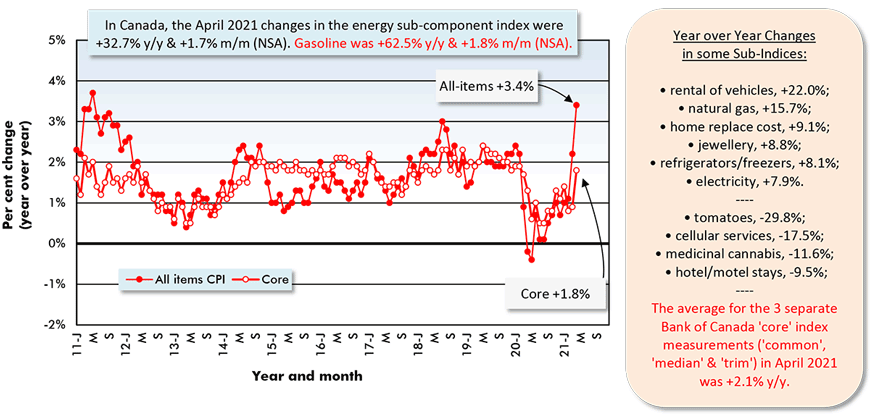
Canadian all-items CPI inflation has shifted to +3.4% (in April) from +2.2% the month previously. Among big hikes in Canadian prices are a couple of energy products: natural gas services, +15.7%; and electricity, +7.9%.
(Not Seasonally Adjusted)
The U.S. figure (CPI-U) is the All Items Consumer Price Index for All Urban Consumers.
*Core inflation is CPI-U less its often most volatile sub-components, food and energy.
Chart: ConstructConnect.
(Not Seasonally Adjusted)
The Canada figure (CPI) is the All Items Consumer Price Index.
*Core inflation is CPI-U less its often most volatile sub-components, food and energy.
Chart: ConstructConnect.
Cost of Newly Built Housing in Canada Soars
Included among Canadian CPI sub-indices is an item labeled ‘homeowner replacement cost’, which has a present reading of +9.1% y/y. The hefty increase is no surprise given the skyrocketing costs of some building materials, notably softwood lumber.
The CPI, however, is by no means the best source of information on the cost of new housing in the country. Rather, Statistics Canada publishes a New Housing Price Index (NHPI) for the nation as a whole and for all major cities.
The NHPI country-wide in April was +9.9% y/y, with land at +7.4% and the designation ‘house alone’ at +10.4% y/y.
Many urban areas are seeing double-digit percentage increases in the cost of newly built homes. Some of the most dramatic climbs have been in Ottawa-Gatineau (Ontario portion), +23.7% y/y; Kitchener-Cambridge-Waterloo, +21.9%; Windsor, +17.9%; Montreal, +17.7%; Quebec City, +14.3%; Vancouver, +12.3%; and Winnipeg, +10.6%.
Retail Sales on a Funhouse Ride
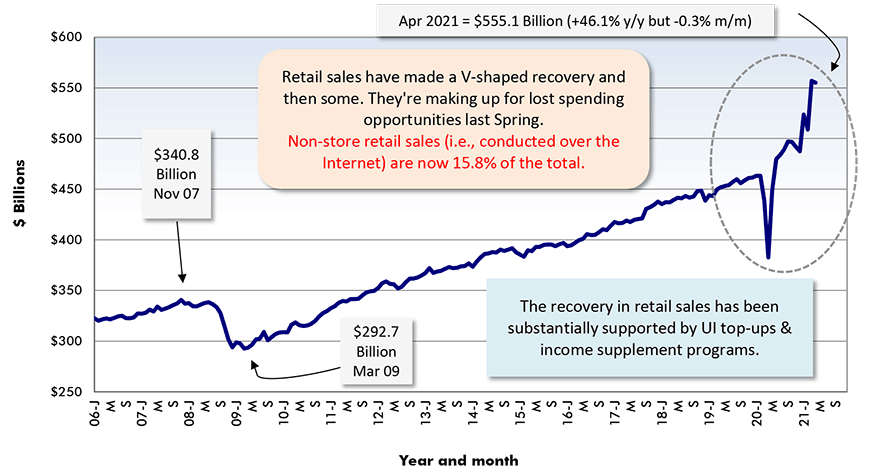
Since most retail sales took a tumble in the Spring of last year, when ‘stay at home’ directives were issued to combat the first shock waves of the coronavirus, comparisons of the current year’s results with 12 months ago are yielding some outrageously high percentage changes.
From Graph 4, total U.S. retail sales in April were +46.1% year over year. In Canada (Graph 5), the figure for March was +23.7% y/y. (Canadian results always lag the U.S. data release by a month).
The percentage changes for individual shopkeeper categories in Graphs 6 and 7 are even wilder ̶ consider the +726.8% gain for U.S. ‘clothing and accessory store’ sales.
One of the few shopkeeper categories that isn’t particularly standing out for sales on a y/y basis in both countries is ‘food and beverage (a.k.a. grocery) stores’, only +1.5% y/y in the U.S. and -9.7% y/y in Canada. Last year’s levels of grocery store sales stayed relatively strong, with fears of shortages leading to extraordinary buying activity, sometimes tagged with the unflattering term ‘hoarding’.
Adjusted for seasonal variation, holiday and trading day differences, but not for price changes.
Chart: ConstructConnect.
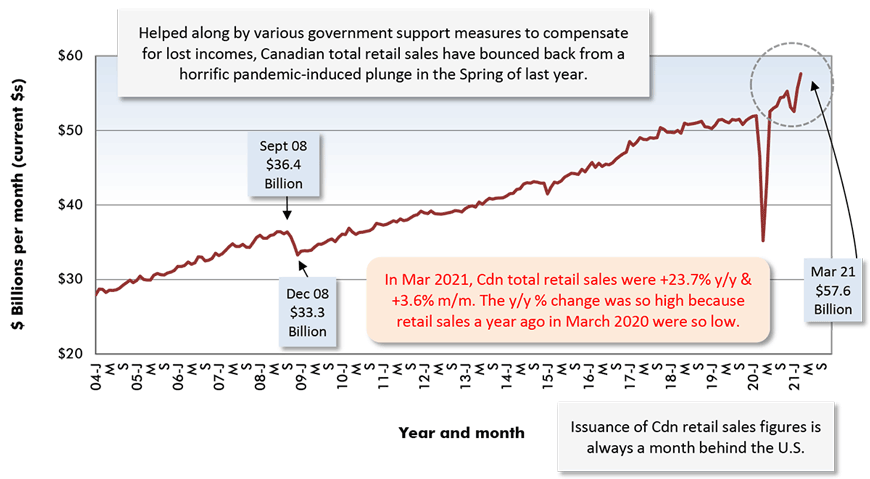
Chart: ConstructConnect.
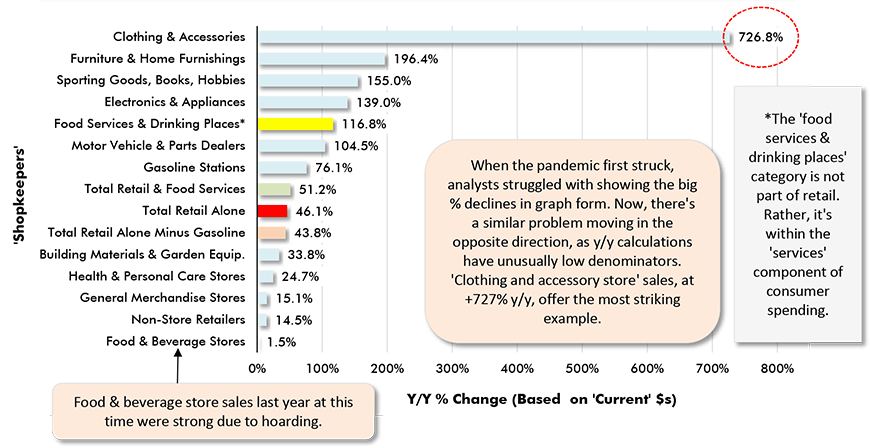
Chart: ConstructConnect.
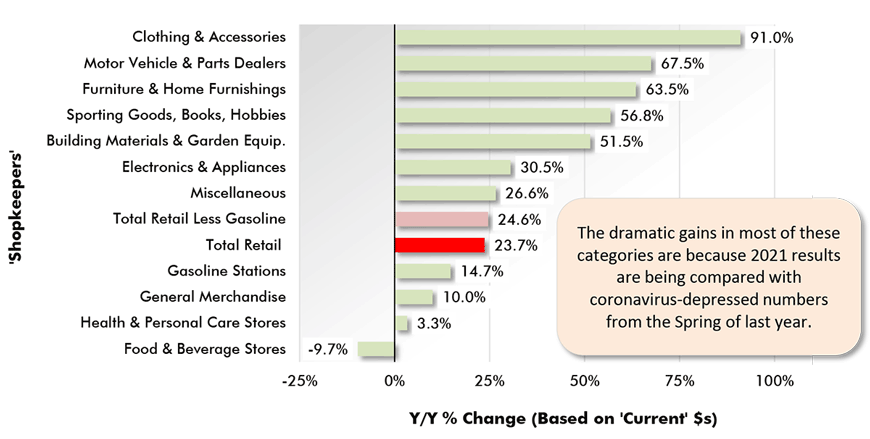
Chart: ConstructConnect.
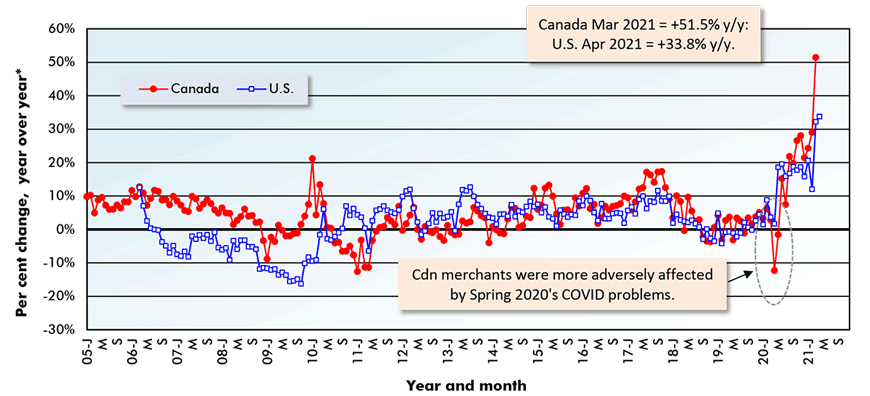
Building Material Supply Sales Have Stayed Tenacious
The retail shopkeeper category with most relevance for the construction industry is ‘building material and garden equipment suppliers’. The ‘garden equipment’ proportion of the total is only about one-sixth.
Graph 8 shows the history of y/y sales by material suppliers for both the U.S. and Canada.
Canadian firms did experience a significant pull-back in sales early last year. U.S. companies, however, during the entire time frame of COVID-19’s visit so far, have never seen a decline at the cash register on a y/y basis.
Most recently, building material and garden equipment supplier sales in the U.S. are +33.8% y/y (April 2021); and in Canada, +51.5% (March 2021). ‘Current’ (i.e., not adjusted for inflation) dollar sales are receiving a boost from strong new and renovation housing activity and from some remarkable uplifts in building material prices, especially among forestry products.
*”Year over year” is each month versus the same month of the previous year.
*’Based on ‘current’ (i.e., no accouting for inflation) dollar and seasonally adjusted data.
Chart: ConstructConnect.
Please click on the following link to download the PDF version of this article:
Economy at a Glance Vol. 17, Issues 80, 81 and 82 – Volatility the Name of the Game with Latest Economic Data Releases – PDF
Alex Carrick is Chief Economist for ConstructConnect. He has delivered presentations throughout North America on the U.S., Canadian and world construction outlooks. Mr. Carrick has been with the company since 1985. Links to his numerous articles are featured on Twitter @ConstructConnx, which has 50,000 followers.


Recent Comments
comments for this post are closed