
Canada’s Labour Market Hopes on Hold
In May, for the second month in a row, total employment in Canada retreated instead of stepping forward, putting a hold on hopes for an improving labour market. The latest month-to-month decline in total jobs was -68,000, coming on the heels of April’s setback of -207,000 jobs.

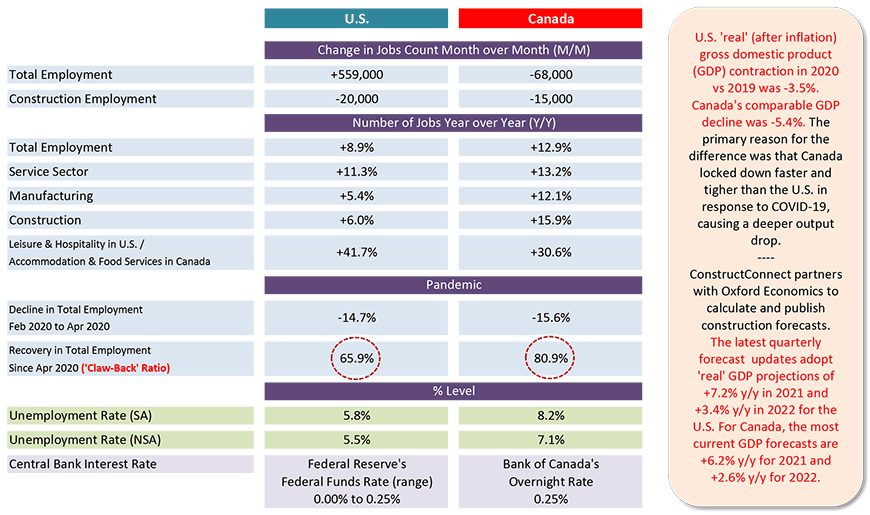
The nation’s seasonally adjusted (SA) unemployment rate in May worsened slightly to 8.2% from the prior month’s 8.1%. The not seasonally adjusted (NSA) U rate stayed flat at 7.1%.
Canada’s jobs recovery ratio ̶ i.e., versus the big loss in employment between February and April of last year ̶ stayed close to 80%, a level where it has hovered for the last several months.
At least, for Canadians, there’s some consolation to be found in their jobs ‘claw-back’ ratio, at 80.9%, being better than America’s, 65.9%.
The Canadian construction sector in the latest month shed -15,000 jobs, but its level of employment is up nicely, +15.9% y/y. (By way of comparison, total employment nation-wide is +12.9% y/y.)
Furthermore, construction’s loss of jobs was less than half the decline (-36,000) recorded by the manufacturing sector. Canadian manufacturing employment is currently (i.e., as of May 2021) +12.1% y/y.
Manufacturing, though, has a better jobs claw-back ratio than construction, 90.9% to 82.9%.
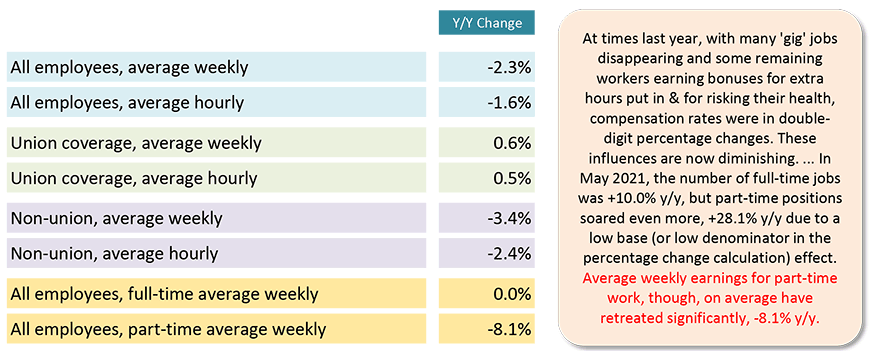
The recent weakness in re-hiring isn’t helping workers maintain the kinds of large compensation increases they were being lavished with last year. For all employees, as set out in Table 3, both average weekly (-2.3%) and average hourly earnings (-1.6%) are off on a year-over-year basis.
In May, average weekly earnings for part-time work recorded the sharpest pullback, -8.1% y/y.
Graph 1: Canada: Month-to-month Total Employment Change
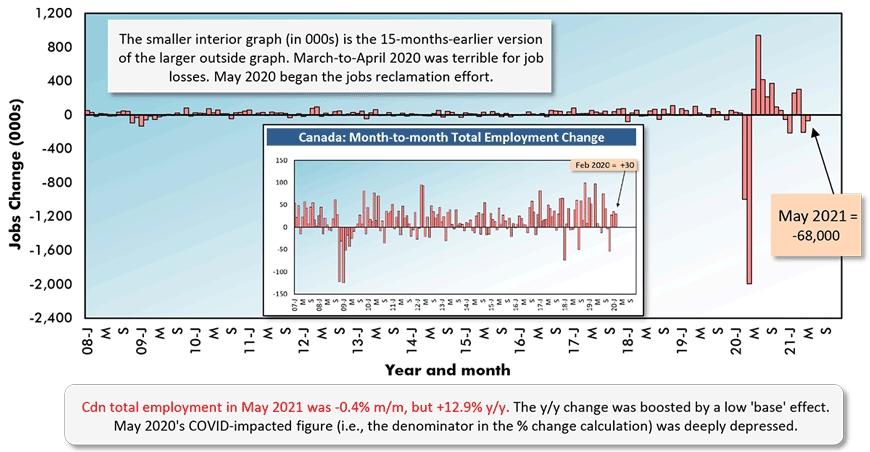
Chart: ConstructConnect.
Table 1: Monitoring the Canadian Employment Recovery ‒ May 2021
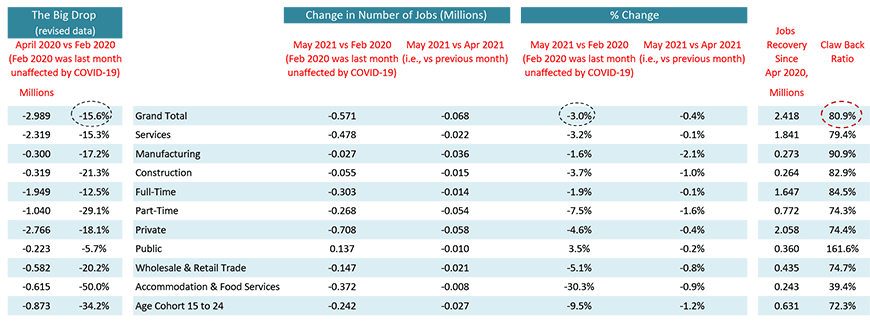
Table: ConstructConnect.
Table 2: U.S. and Canadian Jobs Markets – May 2021
U.S. labor data is from a ‘payroll survey’ / Canadian labour data is from a ‘household survey’.
Canadian NSA unemployment rate ‘R3’ is adjusted to U.S. concepts (i.e., it adopts U.S. equivalent methodology).
Table: ConstructConnect.
Table 3: Canadian Workforce Earnings
Year Over Year, May 2021
‘Current’ means there has been no scaling back to remove effects of inflation.
Table: ConstructConnect.
Graph 2: Manufacturing vs Construction Employment in Canada
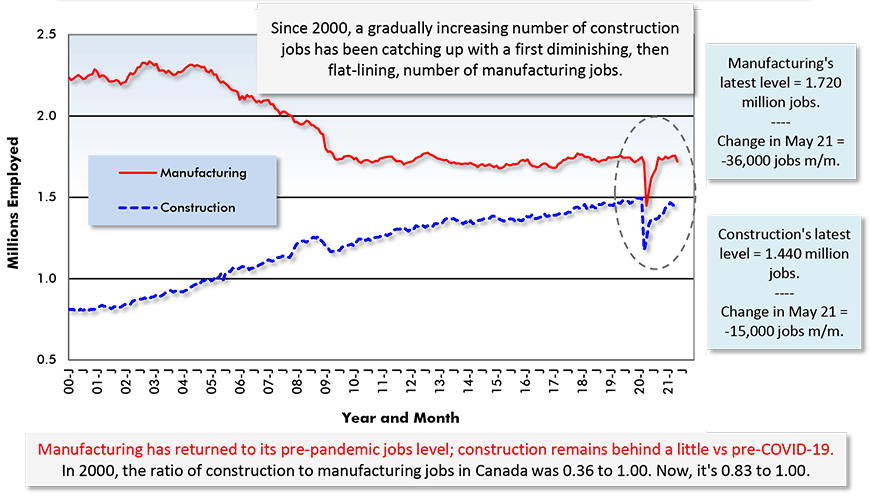
Chart: ConstructConnect.
Graph 3: Canada Employment in Construction vs Manufacturing
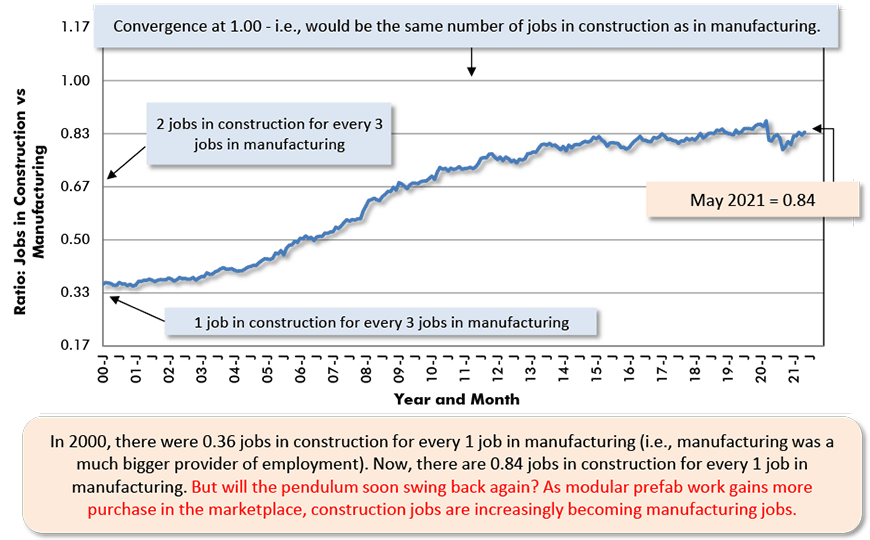
Chart: ConstructConnect.
B.C.’s Workplace the Leader among Provinces
In provincial labour markets, British Columbia is the standout. Only on the West Coast is the unemployment rate (7.0%) lower than the national figure (8.2%) and the rate of y/y jobs increase (+15.1%) greater than the Canada-wide advancement (+12.9%).
Also, B.C.’s share of the national increase in jobs, year over year, at 16.2%, is higher than its slice of the country’s total population, 13.5%.
For Ontario, Quebec and Alberta, their shares of the nation-wide jobs increase y/y are in line with their population representation: Ontario, a 38.8% share for population and a 39.1% share for Canada-wide nominal jobs increase y/y; Quebec, 22.5% and 21.5%; and Alberta, 11.7% and 12.4%.
Table 4: Canada’s Provincial Labour Markets – May 2021
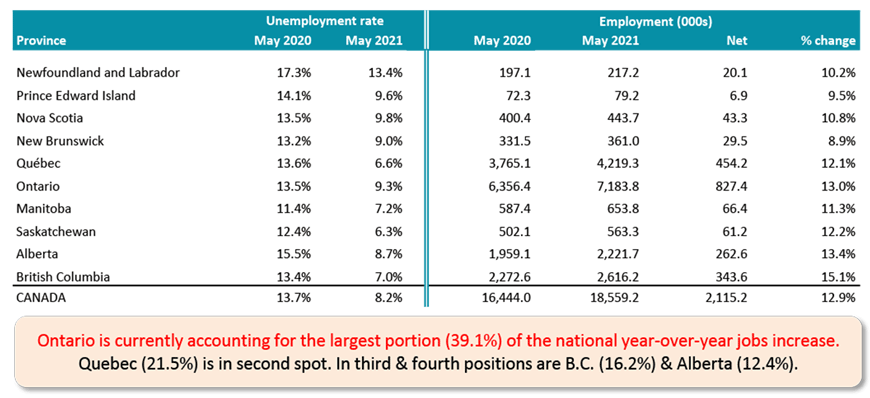
Table: ConstructConnect.
Graph 4: Canada’s Provincial Labour Markets – May 2021
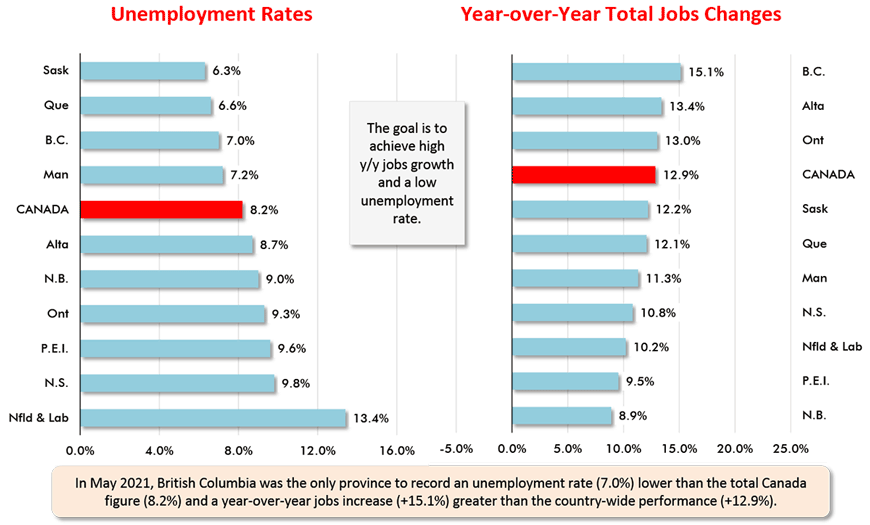
Chart: ConstructConnect.
Please click on the following link to download the PDF version of this article:
Economy at a Glance Vol. 17, Issues 88 and 89 – In May, Canada Disappoints Once Again on the Re-Hiring Front – PDF
Alex Carrick is Chief Economist for ConstructConnect. He has delivered presentations throughout North America on the U.S., Canadian and world construction outlooks. Mr. Carrick has been with the company since 1985. Links to his numerous articles are featured on Twitter @ConstructConnx, which has 50,000 followers.


Recent Comments
comments for this post are closed