
Much is continuing to happen on the economic front. Let’s dig right in with a look at the results from the latest public and private sector data releases. (1) According to the Bureau of Economic Analysis (BEA), U.S. ‘real’ (i.e., after adjustment for inflation) gross domestic product (GDP) shrinkage in full year 2020 relative to full year 2019 was -3.5%. The GDP performances in the latest five quarters for which data is available have been: 2020 Q1 = -5.0%; 2020 Q2 = -31.4%; 2020 Q3 = +33.4%; 2020 Q4 = +4.3%; and 2021 Q1 = +6.4%. The preceding numbers are quarter to quarter results, annualized (i.e., projected out as if they applied for a full 12 months.) The Q2 2021 GDP number will be released on July 29th.

(2) The U.S. Conference Board’s Consumer Confidence Index improved from 120.0 in May to 127.3 in June. The base for the index is 1985 = 100.0. While 127.3 is a high level, it doesn’t quite reach the figures near 140 attained at times, on a monthly basis, in 2018 and 2019; which is to say, before the arrival of the coronavirus pandemic. But also know that the monthly measure of consumer confidence sank into the low 80s on occasion last year, when COVID infections were raging and much of the economy was temporarily sidelined.
(3) The ‘personal savings rate’, as a proportion of after-tax income, in most years is around 8%. In 2020, it soared to 16.4%. Last year, lockdowns limited outlets for spending. Some usual big- ticket purchases, such as vacation packages, were shelved. Holding extra cash pushed the savings rate to a peak of 26.0% in Q2 2020. (The ‘personal savings’ figure is a residual in the National Income accounts, meaning it’s also been boosted, of late, by government income support measures.) After reaching 26.0% in Q2 of last year, it eased in Qs 3 and 4 to 15.7% and 13.6% respectively. But then in Q1 2021, it took flight again, to 21.5%. Brimming consumer confidence and plenty of savings to finance spending sprees suggest there’s scope for outsized GDP growth for several more quarters to come.
(4) There’s a ‘sweet spot’ for the weekly U.S. initial jobless claims figure and it rests between 200,000 and 300,000. When the labor market moves close to the bottom of that range, analysts are normally already speaking of the economy as being near or at full employment. The seasonally adjusted (SA) unemployment rate bottomed out at 3.5% before the pandemic. Coincident with the ultra-low U rate was a weekly initial jobless claims figure that was on the cusp of diving below 200,000.
(5) With the arrival of COVID-19, however, initial jobless claims skyrocketed to a hard-to- believe 6.1 million in early April 2020. Since then, with some bumps along the way, they have gradually worked their way back down to the point where a descent through the 300,000-benchmark again appears within sight. For the period ending July 10, 2021, initial jobless claims fell by 26,000 from the week prior, to reach 360,000. The latest SA unemployment rate for the U.S. economy is 5.9%.
(6) There’s no doubt, though, that inflation is catching everyone’s attention. Last year, with stores closed and most people working from home, and no-one traveling, demand for and prices of many items (e.g., hotel/motel rooms; air fares; office attire) plummeted. Price recovery from low base numbers is accounting for some of the take-off in the overall price level. But there are other forces exerting an influence as well. For example, world commodity prices have been on the march. The global price of oil has returned near $80 USD per barrel. Consequently, gasoline in June’s Consumer Price Index (CPI) data set was +45.1% year over year. In June 2021, the U.S. ‘All Items’ CPI was +5.4% year over year, the most rapid pace of increase in more than a decade. Leaving out food and energy to derive what is known as the ‘core’ rate of inflation, the price climb was a still considerable +4.5% y/y.
(7) One of the more interesting price developments originates in the automotive sector. The ‘new vehicles’ subset of the CPI is +5.3% y/y, not an unreasonable step up. But for people who have greatly reduced their commuting times and are figuring their driving needs can now be satisfied by shopping for a used car or truck, they’re likely to encounter sticker shock. The ‘used cars and trucks’ sub-index of the CPI is +45.2% y/y.
(8) From the time when government first began huge stimulus spending to rescue the economy, the notion that inflation might significantly heat up, after lying dormant for years, seemed increasingly worthy of consideration. To go with the expansive fiscal stance, the Federal Reserve has been pursuing a ‘dovish’ interest rate policy, with its ‘official’ yield between 0.00% and 0.25%. Factoring in inflation, the ‘federal funds rate’ is negative. Is the Fed likely to pre-emptively move interest rates up faster to strike down price hikes? The answer for now, at least, is ‘no’. After a disastrous 2020, it’s too soon to slow the economy.
(9) Also problematic for the Chairman and Governors of the Fed would be having to explain such a ‘hawkish’ course of action to all the people still without jobs but looking to rejoin the workforce. For now, therefore, the pitch to the public is that the spike in inflation will prove to be temporary. Although, one can easily argue that an opposite shift is underway longer term. World trade is picking up and commodity prices are already responding. Also, some key skills shortages, plus lifestyle modifications, are now providing labor with more muscle in its dealings with management. One consequence has been year-over-year wages shifting to higher ground. In June in the U.S., hourly and weekly compensation for ‘all jobs’ bunched around +4.0% y/y.
(10) The table below sets out labor market, and some other comparisons, between the U.S. and Canada. Despite recording a slightly greater decline (-15.6%) in its total number of jobs count between February and April of last year than the U.S. (-14.7%), Canada possesses numbers that are more favorable in a fair number of the line items. The standout figure is Canada’s 88.6% jobs recovery ratio (a.k.a., ‘claw back’ ratio) compared with America’s 69.8%.
Table 1: U.S. and Canadian Jobs Markets – June 2021
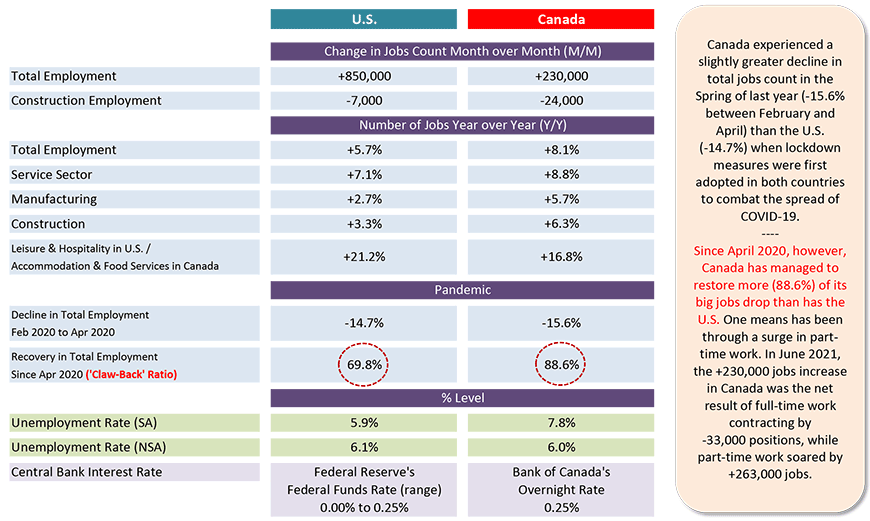
U.S. labor data is from a ‘payroll survey’ / Canadian labour data is from a ‘household survey’.
Canadian NSA unemployment rate ‘R3’ is adjusted to U.S. concepts (i.e., it adopts U.S. equivalent methodology).
Table: ConstructConnect.
Please click on the following link to download the PDF version of this article:
Economy at a Glance Vol. 17, Issue 109 – 10 Mid-July Economic Nuggets – PDF
Alex Carrick is Chief Economist for ConstructConnect. He has delivered presentations throughout North America on the U.S., Canadian and world construction outlooks. Mr. Carrick has been with the company since 1985. Links to his numerous articles are featured on Twitter @ConstructConnx, which has 50,000 followers.


Recent Comments
comments for this post are closed