
This isn’t a hard point to make. A great deal of emphasis in coming years will be placed on de-carbonization. A full court shift to electrification is viewed by many as a primary means to achieve desired and commendable levels of carbon reduction. What is not being presented or discussed thoroughly, though, is how costly this will be. Nor will the shift to greater usage of renewable electric power be the only factor pushing up day-to-day living and business expenses. There are a host of others including investments in cyber security; commitments to employee compliance courses; deeper workplace cleaning efforts; and accelerating adoption of high tech.

Rising inflation, reflected by consumer prices that are climbing quickly, and brought on by material shortages, supply chain interruptions (particularly at West Coast ports), commodity price advances and wage hikes, is one thing. Set aside the inflation issue for a second. There’s a whole separate topic to be covered concerning other measures that are about to make the post-pandemic world an expensive place in which to live and do business. I’ll have more to say on this subject when ConstructConnect hosts its Fall 2021 Economic Webcast: Where to in 2022? Three Chief Economists Light the Way.
The following are some of the NUGGETS to be mined from public and private sector data releases, and other news reports, over the last month. The goal, as always, it to find some key narrative threads through making connections that may not always be obvious.
(1) A significant return to economic normalcy has been delivered by the latest U.S. weekly initial jobless claims number. For the week ending October 9, the figure was 293,000, down by -36,000 from the prior period’s level of 329,000. This marks the first time initial jobless claims have been less than 300,000 since just before the arrival of the coronavirus. For March 14, 2020, the number was 256,000. After another week, and with social-distancing and lockdowns prevalent, it was 2.923 million. Another couple of weeks along, it peaked at 6.149 million for April 4, 2020.
(2) Texas is in the news a lot these days. Ninety-year-old William Shatner, fondly remembered for playing Captain Kirk in the original Star Trek TV show, recently flew into space from a Blue Origin launch site in Van Horn, Texas, far up the state’s border with Mexico. SpaceX sends its tourists aloft from Boca Chica at the state’s southern extremity, where the land mass meets the Gulf. Elon Musk has announced he will be moving Tesla’s head office from California to Texas. Tesla is building two big electricity storage facilities (in other words, giant batteries) in Austin and Houston. They’ve been designed to hold utility-sized power capacity of 250 megawatts each.
(3) But to understand the economic clout of Texas, consider the home building that is taking place there. Year to date through August of this year, in a ranking of America’s 36 most populous metro areas according to number of residential building permits issued, cities in Texas held positions one, two and four. Dallas-Ft Worth was first, with a unit count of 54,441; Houston was second, at 47,735; and Austin fourth, 36,918. (San Antonio was eighteenth, with 16,715).
(4) That’s not the whole Texas residential groundbreaking story. In another ranking of the same 36 cities, but rather by year-to-date percentage changes in residential permits (measured in units), Texas placed three cities in the Top Seven through August. San Antonio was fourth, +44.3% (Jan-Aug 2021/Jan-Aug 2020); Dallas-Ft Worth fifth, +42.3%; and Austin seventh, +40.2%. Houston was back in thirty-second spot, but with a decent increase nonetheless, +8.5%. Remember that this is taking place despite weather-related challenges in the form of hurricanes and last winter’s ice storm that have wreaked havoc on structures and power delivery systems.
(5) The level of general price inflation in the U.S. in September, as measured by the ‘all items’ Consumer Price Index (CPI), was +5.4% year over year. Leaving out volatile food and energy items, to uncover ‘core’ inflation, the y/y rate of increase was +4.0%. Two of the more stunning price increases were for gasoline, +42.1% y/y, and used cars and trucks, +24.4% y/y. Canada’s CPI increase for September won’t be released until October 20th. August’s result, though, was +4.1% y/y, the speediest rate of advance in the nation’s general price level in 18 years.
(6) Under most circumstances, central bankers judge a +2.0% y/y rate of inflation to be not just acceptable, but desirable. It facilitates modest product price and wage increases that make it easier for firms and individuals to pay back fixed-amount loans. When inflation revs up to where it is now, and if it stubbornly persists, the potential for trouble escalates. The first to be negatively impacted will be seniors getting by on pensions that don’t automatically adjust.
(7) Addressing further an overall increasing cost structure there are developments underway in the energy sphere that suggest this coming winter will offer up some heating expense shocks. Moreover, other parts of the world are in a much more precarious position than the U.S. and Canada. Natural gas is priced in terms of one thousand cubic feet (1 mcf) or one million British Thermal Units (1 MMBTUs). They are essentially the same (i.e., 1 mcf produces 1MMBTUs). The Henry Hub price of gas in North America has risen from around $3 USD per mcf to $6 mcf. In Europe, however, where most of the gas is piped in from Russia, with a little coming from Algeria and Libya as well, the price has skyrocketed to $30 USD per mcf. This is also driving up the cost of electricity, since so much generating capacity has switched away from coal.
(8) One barrel of oil produces six million British Thermal Units of energy. Therefore, multiplying the price of gas by six yields the energy-equivalent price of oil. In Europe, presently, the energy equivalent price of oil is $180 USD per barrel. While that may not be what European nations are really paying for Saudi or North Sea crude, it highlights an energy cost crisis regardless. Also, it illuminates an interesting competitive situation for U.S and Canadian oil and gas producers. Compared with firms in Europe, owners on this side of the Atlantic have gained a tremendous advantage in fertilizer, LNG, and petrochemical production. A similar scenario holds true with respect to output from China, Japan, and other Asian nations. The big question is whether our governing and other regulatory bodies will let them run with it. Dow has just seized the moment by announcing plans for a new net-zero carbon-emissions petrochemical plant to be built at the company’s existing site in Fort Saskatchewan, on the outskirts of Edmonton, Alberta.
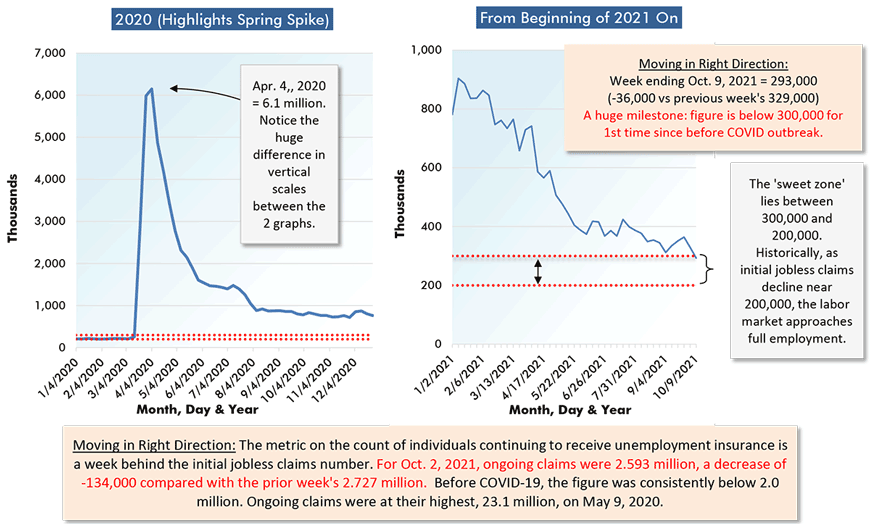
Chart: ConstructConnect.
Alex Carrick is Chief Economist for ConstructConnect. He has delivered presentations throughout North America on the U.S., Canadian and world construction outlooks. Mr. Carrick has been with the company since 1985. Links to his numerous articles are featured on Twitter @ConstructConnx, which has 50,000 followers.
Please click on the following link to download the PDF version of this article:
Economy at a Glance Vol. 17, Issue 144 – 8 Mid-October Economic Nuggets – PDF


Recent Comments
comments for this post are closed