
Concerning the cost of doing business, a lot of attention has been focused lately on sharply rising material input prices. But compensation rates haven’t just been sitting idly by, quietly twiddling their thumbs, either.

There are numerous sources of information on the wages paid to workers in the U.S. and Canada. It would seem logical, though, to turn first to the data provided by the Bureau of Labor Statistics (BLS) and Statistics Canada in their monthly Employment Situation and Labour Force Survey reports respectively. Being included along with the latest jobs numbers means they come, as near as can be, with an ‘official’ stamp.
Tables 1 and 2 below are derived from Table B-8 of September’s BLS Employment Situation Report. The hourly and weekly wage rates are for ‘production and nonsupervisory’ workers. In other words, bosses are excluded. Table 3 below condenses and summarizes material appearing in Table 11 of Statistics Canada’s September Labour Force Survey. In addition to pay hikes, it provides insight into union versus non-union and full-time versus part-time earnings.
Tables 1 and 2 are comprised of 19 lines, but seven of those lines are summaries. What’s more important is that wage results are shown for a dozen major sub-sectors.
From Table 1, when hourly wage rates as a level are ranked from highest to lowest, construction ($30.79) places fifth. Interestingly, it’s way ahead of manufacturing ($24.18) in tenth spot. Utilities ($40.00) is number one. In the lowest two positions are retail trade ($18.68) and leisure and hospitality ($16.71).
From Table 1, when hourly wage rates as year-over-year percent changes are ranked, construction (+5.8%) comes in fourth. Number one is leisure and hospitality (+12.9%), where the exaggerated increase is due to activity in the sector being inordinately weak a year ago. Transportation and warehousing workers have also seen a good gain (+8.6%) as demand for their efforts has skyrocketed to deal with the logistics gaps that have appeared along supply lines.
From Table 2, when weekly wages as a level are ranked, construction ($1,259) is in fourth place after utilities ($1,696), mining and logging ($1,504) and information ($1,340). High occurrences of part-time work push retail trade ($573) and leisure and hospitality ($416) to the bottom.
From Table 2, when weekly wages as year-over-year percent changes are ranked, construction (+10.2%) moves up to second position, just ahead of mining and logging (+10.1%), but in runner-up spot to leisure and hospitality (+13.8%).
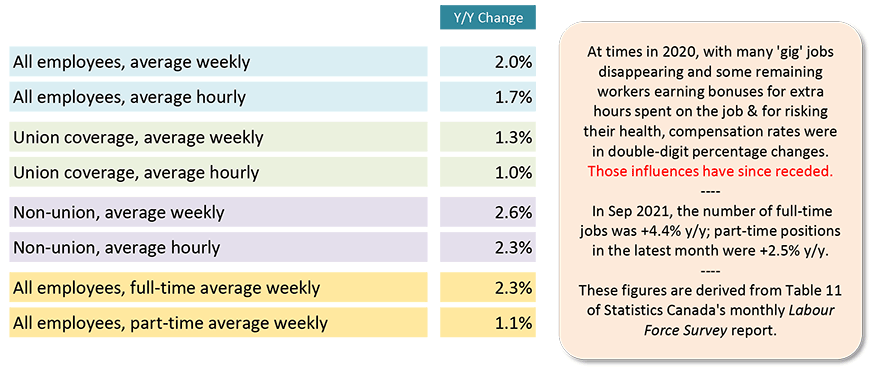
According to Table 3 below, Canadian workers aren’t seeing anything like the same fast year-over-year increases in wages as in the U.S.
Given the difference in exchange rates, U.S. and Canadian average hourly and weekly wages aren’t far off as levels. But American year-over-year pay hikes that are approaching +6.0% for ‘all jobs’ are vastly outpacing Canadian climbs that are generally close to +2.0%.
The highest increase in Table 3 is +2.6% for average weekly earnings by Canadian non-union workers.
There are two other takeaways from Table 3. Non-union-covered workers in Canada are making slightly better wage gains year over year (+2.3% hourly and +2.6% weekly) than those who are union-covered (+1.0% hourly and +1.3% weekly). And full-time employees (+2.3%), with respect to average weekly earnings, have a leg up on part-time employees (+1.1%) by a little more than a percentage point.
Table 1: U.S. Average Hourly Earnings, Production & Nonsupervisory Workers on Non-Farm Payrolls
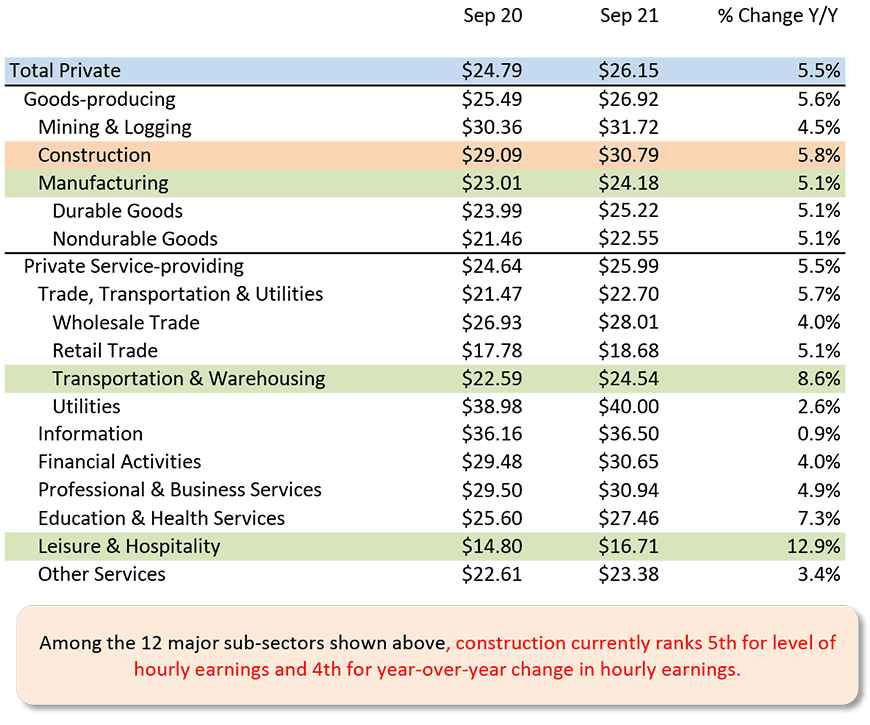
Table: ConstructConnect.
Table 2: U.S. Average Weekly Earnings, Production & Nonsupervisory Workers on Non-Farm Payrolls
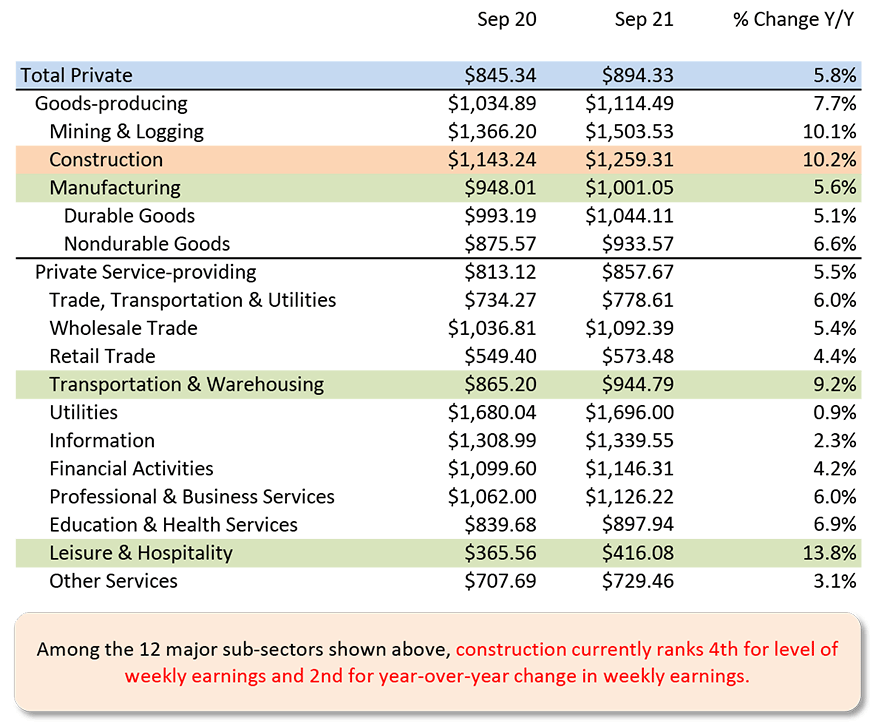
Table: ConstructConnect.
Year over Year, September 2021
‘Current’ means there has been no scaling back to remove effects of inflation.
Chart: ConstructConnect.
Other Labor Market Developments
From Table 4, the U.S. jobs claw-back ratio relative to the big decline in total employment that occurred between February and April of last year is now close to 80%. No doubt, that’s commendable progress. But how about Canada’s performance? Why aren’t there more bells ringing north of the border? Canada has achieved a full recovery of its total jobs count that existed before COVID-19 rode into town on a pale horse and forced nearly everyone to take shelter at home.
Graph 1 shows that the not seasonally adjusted (NSA) unemployment rates in both the U.S. and Canada have continued to be nearly the same for a long time. Canada’s R-3 number is a special calculation carried out by Statistics Canada utilizing the same methodology as is adopted south of the border.
Table 7 and Graph 2 examine labour markets in Canadian provinces. Currently British Columbia is the only jurisdiction with both a year-over-year increase in employment (+6.1%) that is greater than the national advance (+4.0%) and an unemployment rate (5.9%) that is lower than the seasonally adjusted total Canada figure (6.9%).
As for the year-over-year increase in total employment in Canada, Ontario (with a 44.6% share) and B.C. (with a +20.6% share) combined are accounting for two-thirds of the jump.
Table 4: Monitoring the U.S. employment recovery ‒ September 2021
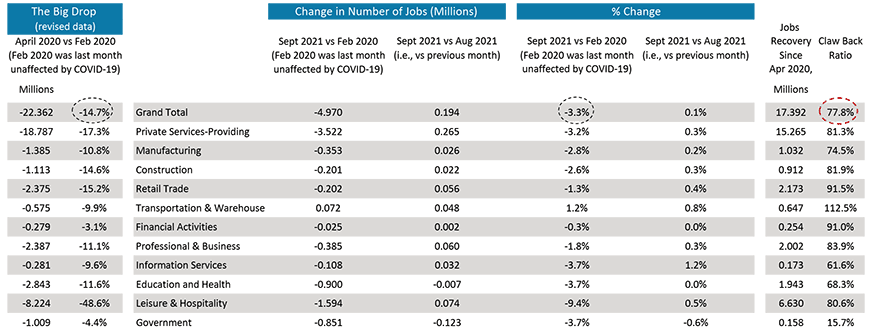
Chart: ConstructConnect.
Table 5: Monitoring the Canadian Employment Recovery ‒ September 2021
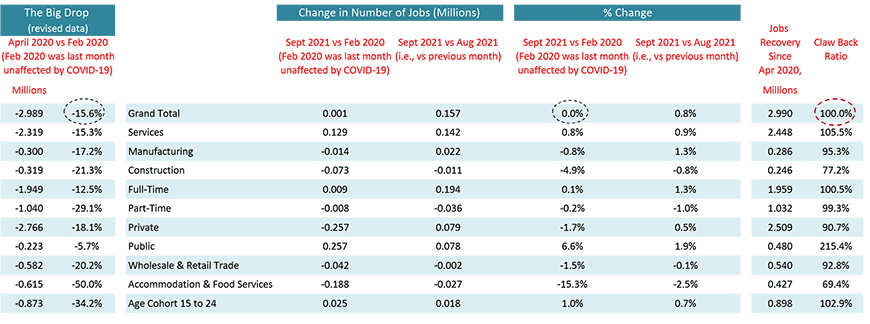
Table: ConstructConnect.
Table 6: U.S & Canadian Jobs Markets – September 2021
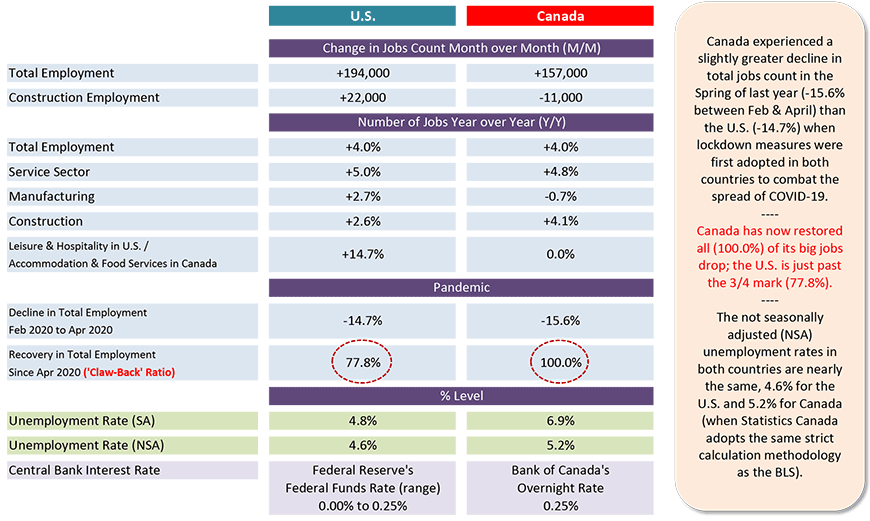
U.S. labor data is from a ‘payroll survey’ / Canadian labour data is from a ‘household survey’.
Cdn NSA unemployment rate known as ‘R3’ is adjusted to U.S. concepts (i.e., it adopts U.S. equivalent methodology).
Table: ConstructConnect.
Graph 1: Canada vs U.S. Monthly Unemployment Rate (Percent)
Not Seasonally Adjusted (NSA) Data
(Statistics Canada Calculates ‘R-3’ on Same Basis as U.S. Rate)
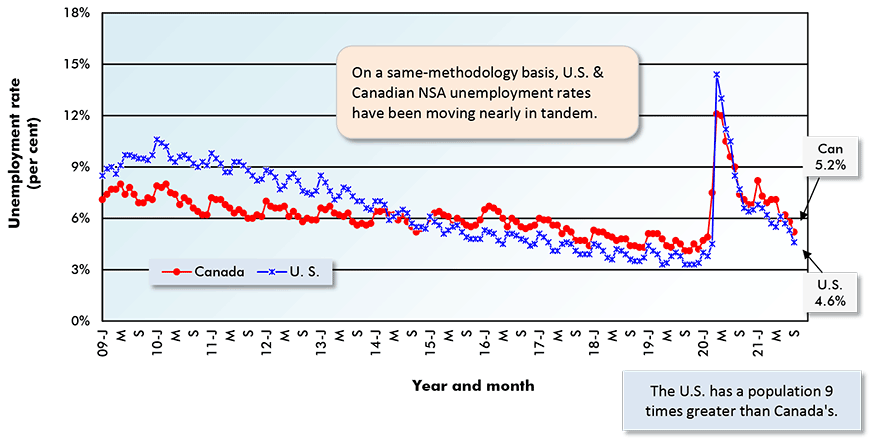
Chart: ConstructConnect.
Table 7: Canada’s Provincial Labour Markets – September 2021
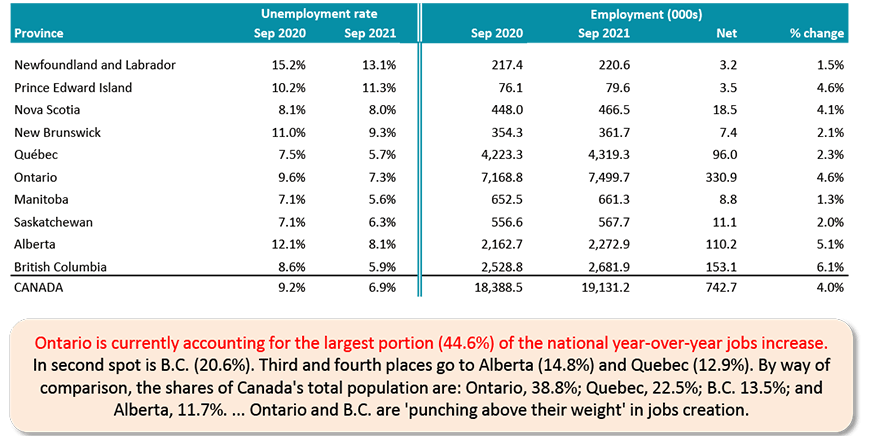
Table: ConstructConnect.
Graph 2: Canada’s Provincial Labour Markets – September 2021
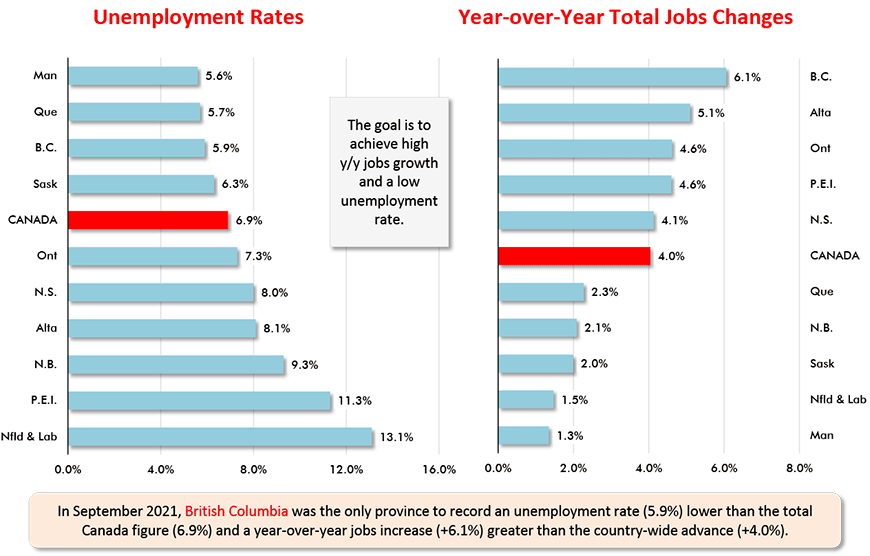
Chart: ConstructConnect.
Alex Carrick is Chief Economist for ConstructConnect. He has delivered presentations throughout North America on the U.S., Canadian and world construction outlooks. Mr. Carrick has been with the company since 1985. Links to his numerous articles are featured on Twitter @ConstructConnx, which has 50,000 followers.
Please click on the following link to download the PDF version of this article:
Economy at a Glance Vol. 17, Issues 145, 146 and 147 – Wages Advance Mightily in U.S.; Maintain Moderation in Canada – PDF


Recent Comments
comments for this post are closed