
There’s no getting away from it, the opening sentence of a story on present economic circumstances has to feature inflation. So that’s where we’ll begin our NUGGETS report this month, with the first point below laying out the broad strokes. Then we’ll delve deeper into today’s pricing and costing structures, and what additional knock-on implications are being revealed by other recent public and private sector data releases.
 (1) The headlines are flashing that at +9.1% year over year, the advance in the U.S. Consumer Price Index (i.e., CPI-U for Urban consumers) is the fastest in 40 years. The price of food is +10.4% y/y; the price of food at home is +12.2%. Most alarmingly, gasoline is +59.9% y/y. The consumer inflation relevance for construction is that interest rates are being raised accordingly.
(2) But there are many items for which the price increase is moderating. That doesn’t necessarily mean that their levels have dropped. Rather, the year-over-year comparison has eased, because the price for the good last year was on an incline from one month to the next. For example, the hotel/motel sub-index within the CPI is currently +11.5% y/y. Three months ago, it was +29.0%.
(3) ‘Appliances’ in the CPI are now +6.5%; three months ago, they were +8.0%. The ‘used car and truck’ sub-index is +7.1%; four months ago, it was +41.2%. More dramatically, ‘car and truck rentals’ this June were -7.7% y/y; a year ago, they were +87.8% y/y. The U.S. ‘core’ rate of inflation, which omits outrageously price-volatile food and energy components, is presently +5.9% y/y. A quarter ago, in March, CPI ‘core’ was worse at +6.5%.
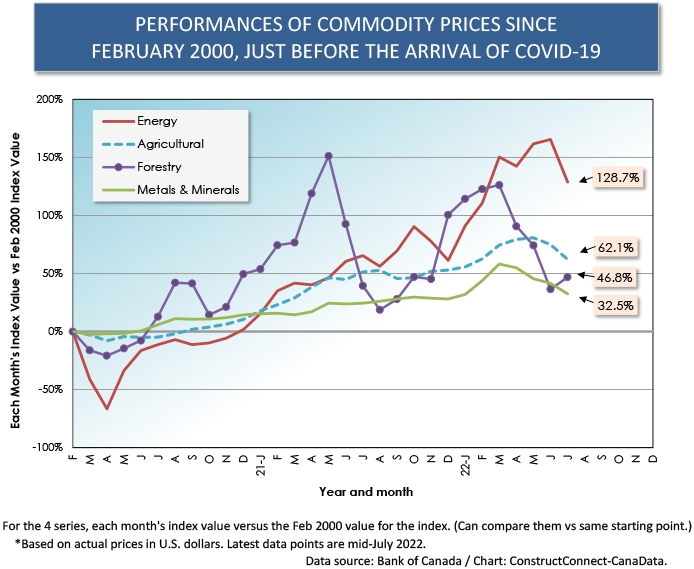
(4) Based on U.S. dollar-denominated prices, the Bank of Canada publishes summary commodity price indices for energy, forestry, and agricultural products, plus metals and minerals. The indices have all stepped back from their peak increases registered in the period since February 2000, which was just prior to when COVID-19 walked on stage from the wings.
(5) The ‘forestry products’ index was +151.2% in May 2021 versus its level in February 2020; now (mid-July 2022), it’s +46.8%. The ‘metals and minerals products’ index was +58.2% in March 2022; now it’s +32.5%. The ‘agricultural products’ index was +74.1% in May 2022; now, it’s +62.1%. And the ‘energy products’ index was +165.5% in January 2022; now, it’s +128.7%.
(6) The ‘total commodities’ price index maxed out in March 2022 at +121.3% compared with February 2020 and is now +93.1%. Expressed in a hopefully simpler fashion, the ‘total commodities’ price index is presently -12.7% versus peak, with ‘forestry products’ -41.5%; ‘metals and minerals’, -16.2%; ‘agricultural products’, -10.3%; and ‘energy products’, -13.8%.
(7) China has long been counted on to support commodity prices, but that nation’s economy is not the pillar of strength it once was. In particular, the residential real estate industry is in disarray. Some of the largest firms in the sector (e.g., Evergrande) have slipped into loan default, creating uncertainty as to whether projects will be completed. In China, new home purchasers are required to make mortgage payments as work is underway and before they move in. A massive and unprecedented protest movement is now underway to withhold such mortgage payments.
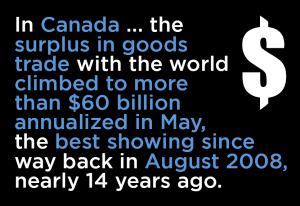
(8) Commodity prices may be easing, but they are still at levels that are quite elevated, for the most part, thereby influencing foreign trade statistics. In Canada, thanks largely to restorations of better pricing for oil, natural gas and other raw materials, the surplus in goods trade with the world climbed to more than $60 billion annualized in May, the best showing since way back in August 2008, nearly 14 years ago.
(9) The U.S. foreign trade balance remains deeply in arrears, in excess of minus a trillion and half dollars annualized in some recent months. A proposal has been floated that the U.S. should lower tariffs, especially on goods from China, as one means to help dim the wattage on inflation. But know that lower tariffs will spur the importation of more offshore goods, making what is already a fairly dire U.S. merchandise trade situation worse.
(10) In what may soon be a recessionary environment, it’s their different foreign trade outlooks (i.e., problematic for the U.S. vs rosier for Canada), that is a distinguishing feature between the two economies north and south of the border. Furthermore, the Euro has fallen into parity with the U.S. dollar, making American goods sold on the other side of the Atlantic more expensive.
(11) In construction markets, and largely tied to resource sector development, a wealth of mega-sized (i.e., billion dollar or more) projects used to separate the Canadian scene from the American. That’s a disparity, however, that has all but disappeared. Presently, both the U.S. and Canada have long lists of ultra-large projects either being green-lighted or hanging on the cusp of go-aheads. These include new EV production lines, battery plants, computer chip-making factories, new steel mills, LNG export facilities, rapid transit roll outs, and electric power generation and transmission works. The initiation of many of these may prove surprisingly resilient regardless of the economic forces working against more cyclically inclined elements of construction (e.g., housing starts, and other investments governed mainly by interest rates).
(12) The problem of student loan debt, along with inflation, is another one of those ‘foremost issues’ plaguing the economy. It’s interesting that the ‘college and university tuition fee’ sub-index of the CPI is +2.0% year over year, the same degree of pickup judged optimal for the overall price level. As another indication that all is not bad on the inflation front, the cost of ‘personal computers and peripheral equipment’, as set out in the CPI data set, is -0.6% y/y.
Graph 1
Alex Carrick is Chief Economist for ConstructConnect. He has delivered presentations throughout North America on the U.S., Canadian and world construction outlooks. Mr. Carrick has been with the company since 1985. Links to his numerous articles are featured on Twitter @ConstructConnx, which has 50,000 followers.


Recent Comments