
Global Stock Market Improvements Broadly Based, Finally
On the world economic stage, matters have been taking a turn for the better once again. Table 1 shows that for the first time since before the pandemic, all the major stock markets globally registered year-over-year index gains at the end of March.

For much of last year, only the North American indices managed to make headway. Presently, the increases are broadly based. Even the two exchanges with the poorest records, Hong Kong’s Hang Seng and London’s FTSE, are up by decent, if not outstanding amounts, +20.2% and +18.4% respectively.
Furthermore, NASDAQ has surrendered leadership status among all indices. The ‘small cap’ Russell 2000 index pulled off the biggest year-over-year jump at the end of this year’s Q1, +92.6%. NASDAQ was in second place, at +72.0%, but third, fourth and fifth spots were claimed by foreign indices: ‘iShares Emerging Markets, Asia’, +59.3%; ‘iShares Emerging Markets, Worldwide’, +56.3%; and Tokyo’s Nikkei 225, +54.2%.
The German DAX 30 has also done well, +51.0% y/y as of March 31st, keeping up with the S&P 500, +53.7%, and the DJI, +50.5%. In March, The German DAX 30 scored the highest month-to-month gain among the 14 indices, +8.9% (see Table 2).
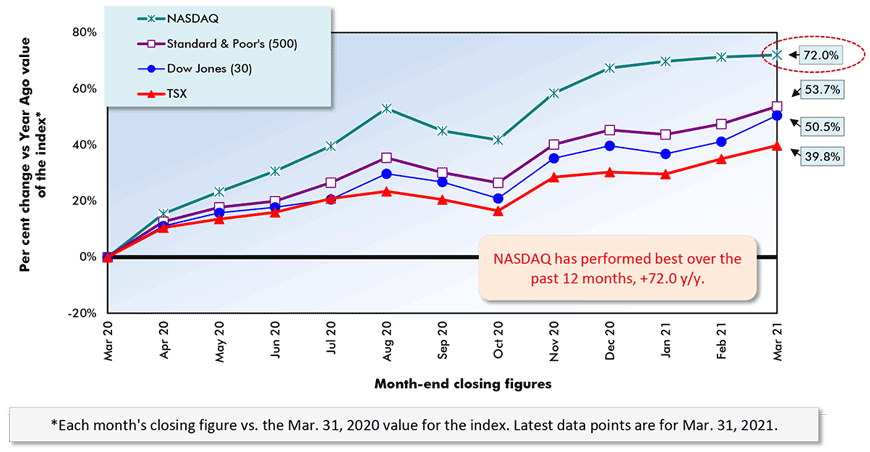
Graph 1 illustrates how the NASDAQ index has flattened out of late, as investor attention has shifted mildly away from high-tech firms towards traditional cyclical winners, and companies that will benefit from the pick-up in world trade that is in its nascent stage.
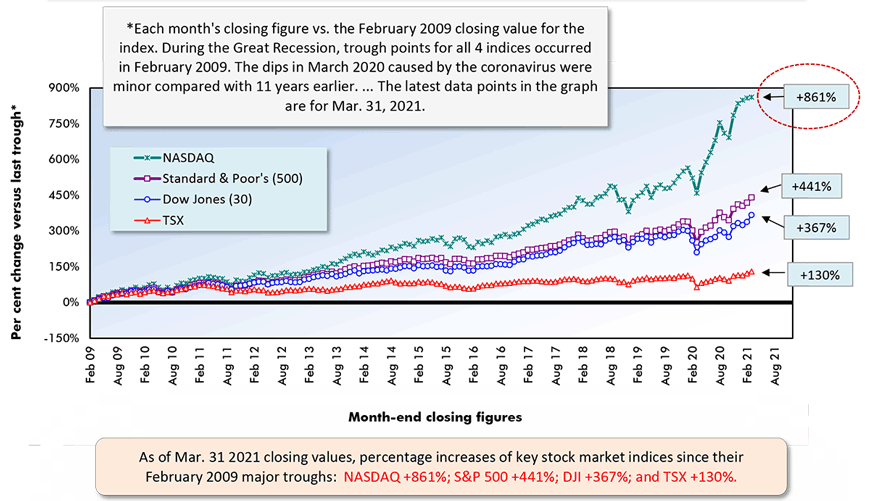
Not to be overlooked, however, Graph 2 sets out the truly remarkable increases realized by the U.S. major indices since their last major troughs in February 2009. The DJI in the past dozen years has climbed +367%; the S&P 500, +441%; and NASDAQ, +861%.
Year over Year as of Month-end Closings, March 31, 2021
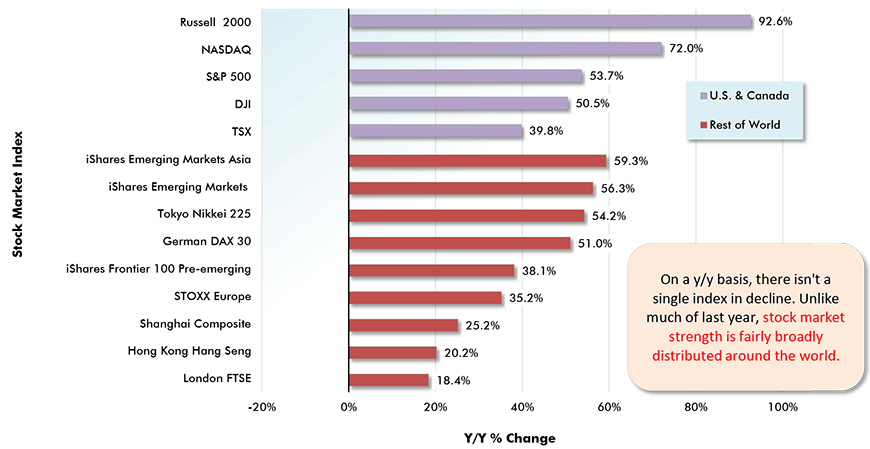
Chart: ConstructConnect.
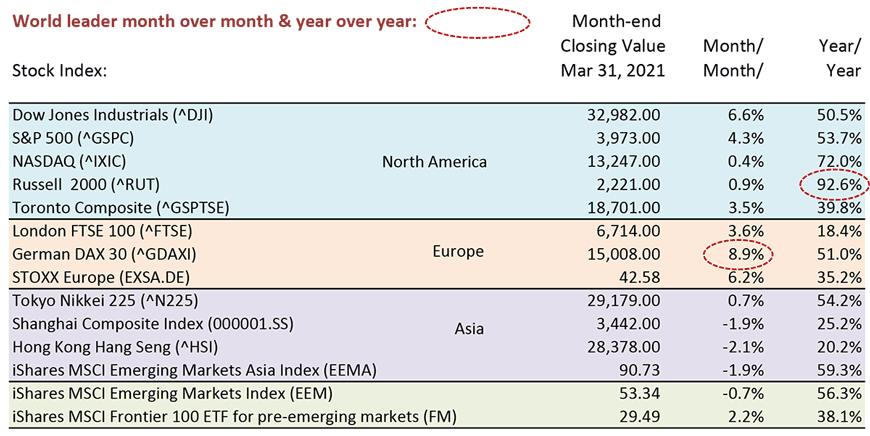
Table: ConstructConnect.
Securities Dealers Automated Quotations (NASDAQ), Toronto Stock Exchange (TSE) and Reuters.
Chart: ConstructConnect.
Securities Dealers Automated Quotations (NASDAQ), Toronto Stock Exchange (TSE) and Reuters.
Chart: ConstructConnect.
Canadian Foreign Trade Benefitting from Commodity Price Hikes
The improvement in economies around the world, with bounce-back increases in gross domestic product (GDP) to offset the terrible declines that occurred when the coronavirus first came on the scene, are being accompanied by some hefty commodity price increases that are of benefit to some countries, for example Canada.
From Graph 3, in January and February of this year, Canada experienced its first period of back-to-back monthly surpluses in ‘goods’ foreign trade in four years. Revivals in prices for energy, agricultural and forestry products have been playing pivotal roles. Rising metal and mineral prices (gold and copper) have also been a help.
From Graph 4, Ontario’s clear leadership in export sales among all the provinces is one highlight. Alberta’s second-place position ahead of Quebec is another. Of course, Alberta is especially known for supplying light and heavy oil to the U.S. marketplace, and that circumstance will feature prominently when Graph 8 comes to the fore.
Also notice from Graph 4, however, that the biggest year-to-date percentage gains in exports have been achieved by British Columbia, +23.4%, and Saskatchewan, +13.0%. Taking the analysis one step further, Graph 5 pinpoints that B.C.’s export success has been primarily in forestry products, +49.2% ytd, while Saskatchewan’s has been in agricultural products, +35.1%.
Quebec has also managed a reasonable increase in forestry product export sales, +16.1% ytd. B.C. and Quebec have been trying to help the U.S. with its lumber supply shortage, that has seen prices skyrocket, but there are limitations, in the form of duties and quotas, on how much Canadian producers can come to the rescue.
Graph 3: Canada’s Foreign Trade: The Merchandise Trade Balance − February 2021
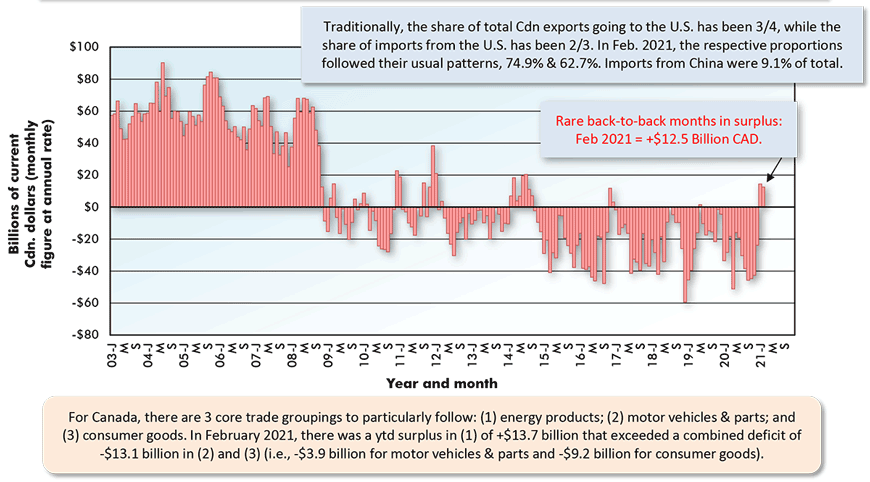
The last data point is for February 2021.
Based on seasonally adjusted monthly figures, projected at an annual rate.
Data source: Statistics Canada.
Chart: ConstructConnect.
Graph 4: Provincial Export Sales, Jan-Feb 2021
Ranked by $ Volume (also showing YTD % changes – i.e., vs Jan-Feb 2020)
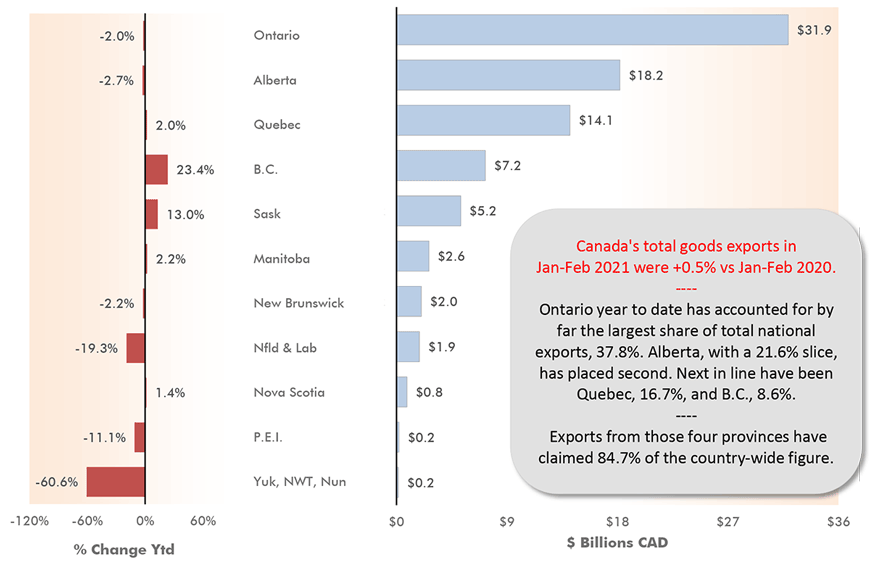
Data source: Statistics Canada.
Chart: ConstructConnect.
Graph 5: Canada’s Key Export Product Sales by Province
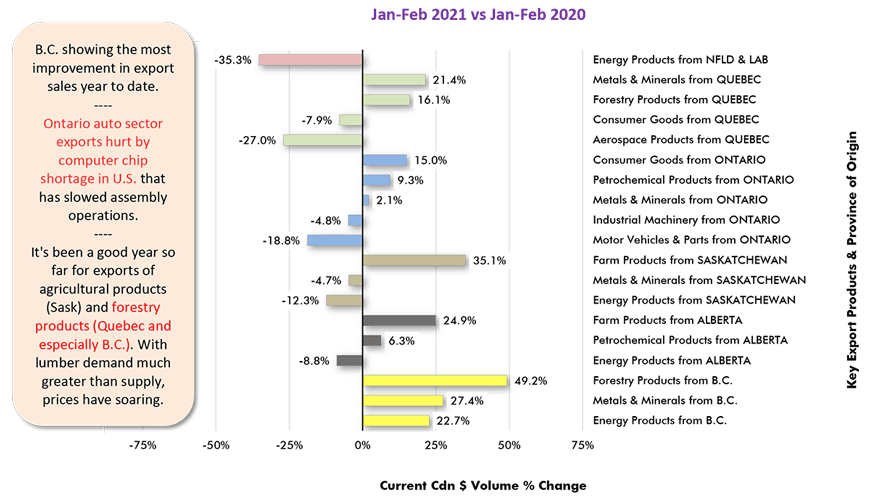
Data source: Statistics Canada Table 12-10-0119-01.
Chart: ConstructConnect.
U.S. Goods Trade Deficit Threatens to Become Truly Unruly
While stronger U.S. GDP growth is greeted with enthusiasm, there is one odd and problematic consequence. History has shown that a stronger U.S. economy is accompanied by import increases in excess of the pickup in export sales and current tariffs on steel and aluminum notwithstanding, that’s what is occurring now.
From the middle text box in Graph 6, the U.S. trade balance in ‘goods’ has just set a record shortfall, -$1.056 trillion. This will bear close watching in the months ahead.
Drawing from the exceptional levels of pent-up demand that exist across many facets of the economy, and the high personal savings rates that will permit wish fulfilments, there are plenty of reasons to expect a significant take-off in the U.S. economy as the rest of a vaccination-intense 2021 unfolds.
Given the speeding up growth scenario, there’s the danger that the merchandise trade deficit will deteriorate from being an annoying itch to becoming truly unruly.
Graph 6: United States’ Foreign Trade: Goods and Services Balance − February 2021
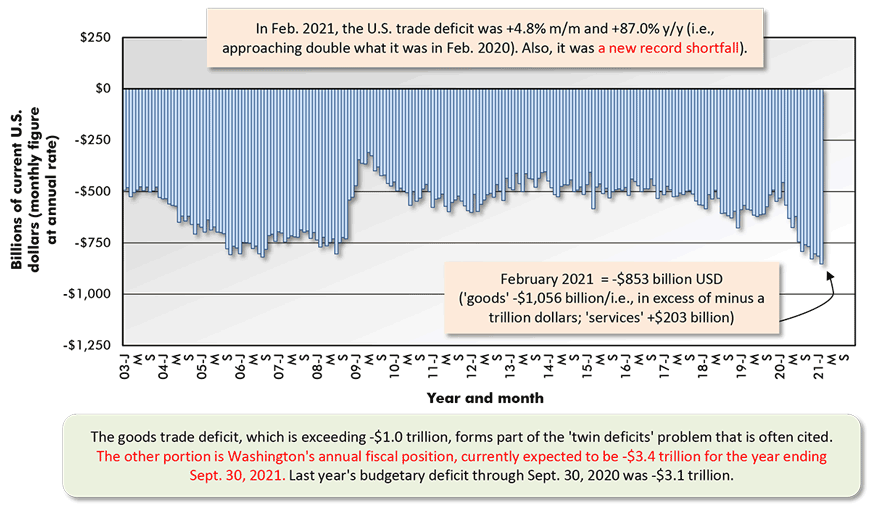
The last data point is for February 2021.
Based on seasonally adjusted monthly figures, projected at an annual rate.
Data source: Bureau of Economic Analysis (BEA).
Chart: ConstructConnect.
Two-Thirds of U.S. Oil Imports from Canada
From Graph 7, while the U.S. trade deficit with China has been beaten back to about one-third of the total from the one-half share it often held several years ago, other nations have stepped forward. Ireland (due to pharmaceuticals) in February claimed a proportion of the U.S. goods trade deficit (7.8%) that exceeded either Germany (6.2%) or Japan (5.8%), although it failed to match Mexico (9.1%). ‘Rest of world’, though, comprised of countries mainly in Asia, has stepped further into the spotlight.
U.S. oil imports used to be a key component of the goods trade deficit. Not anymore.
From Graph 8, U.S. crude imports in barrels were -15.1% ytd through February. Purchases from OPEC nations were -49.1% and from Saudi Arabia, -48.7%.
More than two-thirds (67.1%) of U.S. oil imports are now coming from Canada.
Movements to stop expansions of the pipeline system supplying America with Canadian oil may be carrying the day in courts and in the political arena, but there should be recognition and admission of an offsetting side effect, ̶ the north-south movement of more energy-laden tanker rail cars.
Graph 7: Geographic Sources of U.S. Total Foreign Trade Deficit in Goods – February 2021
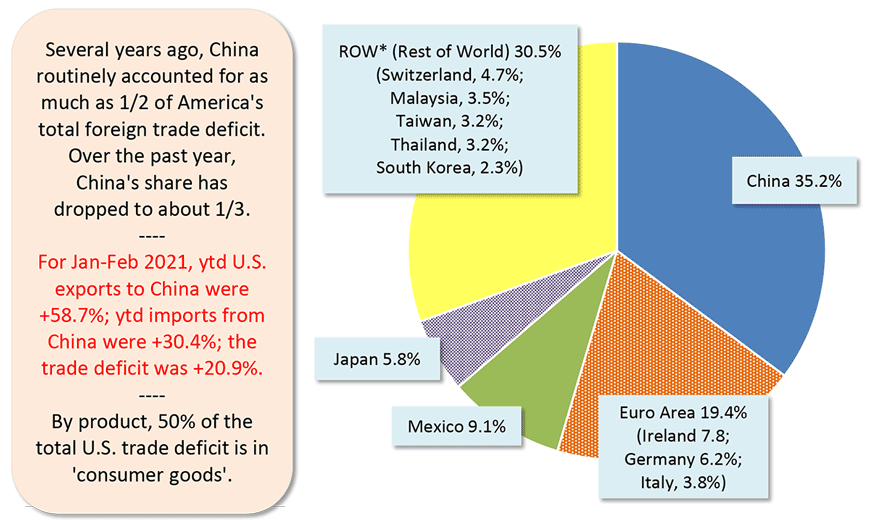
Data source: U.S. Census Bureau and Bureau of Economic Analysis (BEA).
Chart: ConstructConnect.
Graph 8: Foreign Sources of U.S. Imported Oil
% of Total Barrels – Jan-Feb 2021
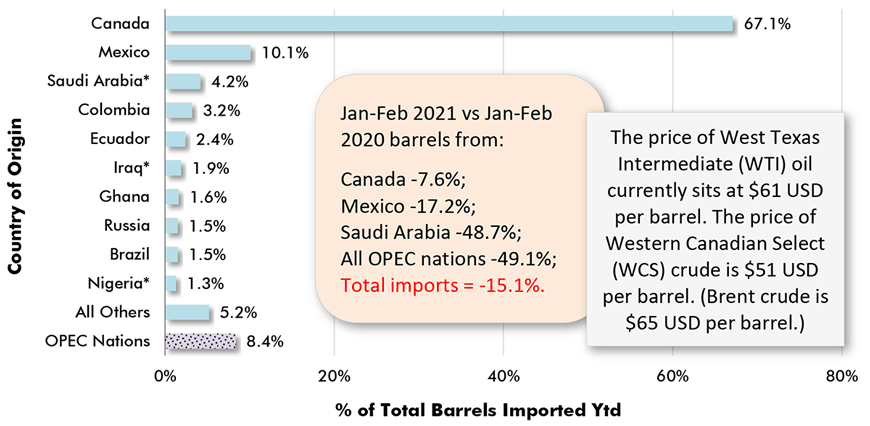
* Asterisk indicates country among OPEC members. Ecuador left OPEC in January 2020.
Data source: Census Bureau & Bureau of Economic Analysis (BEA).
Chart: ConstructConnect.
Please click on the following link to download the PDF version of this article:
Economy at a Glance Vol. 17, Issues 63, 64 and 65 – Deciphering the Interlocking Stock Market-Global Trade Story – PDF
Alex Carrick is Chief Economist for ConstructConnect. He has delivered presentations throughout North America on the U.S., Canadian and world construction outlooks. Mr. Carrick has been with the company since 1985. Links to his numerous articles are featured on Twitter @ConstructConnx, which has 50,000 followers.


Recent Comments