The first data release from Canada’s Core Public Infrastructure Survey paints a picture of a vast network of roads long enough to circle the globe at its equator over 19 times, with six of 10 roads in good or very good shape but a substantial number of bridges nearing the end of their useful lives.
The survey, released Aug. 24, was a commitment made in the federal government’s 2016 budget to enable more evidenced-based decisions in developing public infrastructure policy, Ministry of Infrastructure and Communities spokesperson Kate Monfette explained.
Roads and bridges, the first two of nine types of infrastructure identified, were catalogued in the initial data release, representing a look at those structures as of 2016. The information was compiled by Statistics Canada.
“The results of Canada’s Core Public Infrastructure survey will establish an important baseline for measuring the impact and progress from infrastructure investments over time and will provide valuable benchmarks to help communities assess and prioritize local infrastructure projects,” said Minister of Infrastructure Francois-Philippe Champagne in the release.
Among the findings:
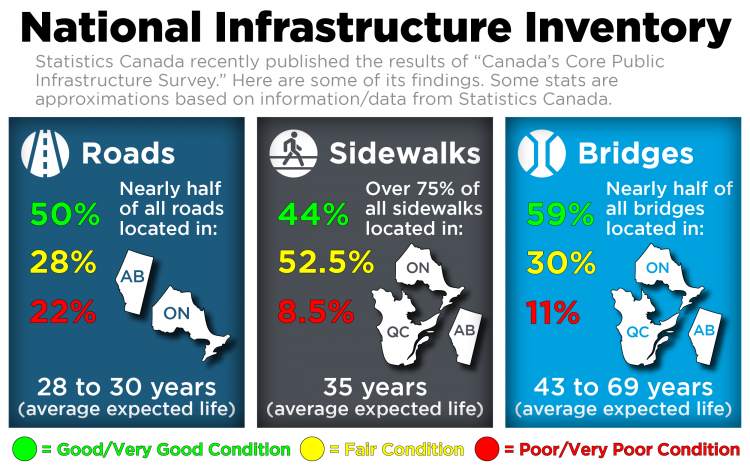
- In 2016, the country had more than 765,000 kilometres of publicly owned roads, 68.3 per cent of which were owned by municipalities.
- Almost half of all roads in Canada were located in Ontario and Alberta.
- Over half of the highways (59.3 per cent), local roads and arterial roads in Canada were deemed to be in very good or good physical condition.
- In 2016, over 40 per cent of all road owners had an asset management plan, with Ontario road owners most likely to have a plan in place (88.3 per cent).
- While one-fifth of bridges have been built since 2000, the study shows bridge construction was more intense between 1940 and 1969 compared with 1970 to 1999 for almost every type of bridge.
Andy Manahan, executive director of the Residential and Civil Construction Alliance of Ontario (RCCAO), sifted through some of the data with former Ontario deputy minister Michael Fenn, a regular contributor to RCCAO infrastructure research, and said it’s important to determine how the information will be used.
“Certainly more data is better, but it’s how data is packaged and used that is critical,” said Manahan. “Because it is high level information at this stage, I would exercise caution in using this survey to make policy decisions.”
An initial observation he had after Fenn had shared notes, Manahan said, was that there did not seem to be new types of infrastructure identified, so the survey looks back at past practices.
“The risk is, just showing current state and history might have a slight bias in favour of rehabilitating infrastructure rather than modernizing and making some really tough decisions in favour of new technology and new ways of doing things,” he said.
Manahan noted there had been other important infrastructure surveys conducted, including the Report Card series spearheaded by several groups including the Canadian Construction Association.
“How do we tie all this research together?” he asked. “The report card was taking a forward-looking view. At least at this stage, it (the survey) is a snapshot but it is not doing any policy analysis so that is a gap in this survey so far.”
Manahan said there could also be differences in the way asset management plans are assembled and in how life spans of assets are determined — perhaps with varying results depending on whether the life cycles were assessed by a public works staffer or an engineer, he noted as an example.
Noting the large number of bridges that were built half a century ago, Manahan said, “That is a big responsibility and potentially a large cost burden, when there is a situation when the life expectancy of a bridge is derived to be 60 years. If a lot of those bridges were built in the 1950s, that’s a ticking time bomb there.”
Monfette said in a note, “We are developing tools and analytical systems that can measure and assess how various federal infrastructure investments are delivering on the economic, social and environmental outcomes that Canadians want and deserve.”
Manahan said the RCCAO would want to contribute to this process.
“There is good data in this, but there is other data that would be helpful in terms of how well these assets are utilized and how are they being stressed,” he said.
“That may be for future surveys.”
Culvert Intelligence: Know Your Infrastructure
OTTAWA — Statistics Canada, in partnership with Infrastructure Canada, has launched a catalogue of the state of the nation’s infrastructure to provide statistical information on the stock, condition, performance and asset management strategies of Canada’s core public infrastructure assets.
The first release, issued Aug. 24, presents findings on roads, bridges and tunnels as of 2016.
Did you know:
- There were 351 publicly owned tunnels in 2016, with Nova Scotia and British Columbia each accounting for about one-quarter.
- There were 30,397 publicly owned culverts three metres or larger in diameter in 2016. Ontario led the way at 41.4%. Culverts had an average expected useful life of 46 years, ranging from 26 years in Newfoundland and Labrador to 75 years in New Brunswick.
- Ontario and Alberta had the highest share of local roads located within their boundaries, with nearly one-quarter of the total in each. Alberta (23.1%) and Ontario (21.3%) also had the highest shares of collector roads in the country.
- Alberta (28.4%) and Saskatchewan (23.9%) accounted for the largest share of highways.
- From 1970 to 1999, 50.1% of all highways were built.
- The average expected useful life of all road types ranged from 28 to 30 years.
- Just under half of collector roads (47.7%) were deemed to be in very good or good physical condition, while 37.3% of lanes and alleys were in very good or good physical condition.
- Among owners with an asset management plan, 22.7% updated the plan every year, 30.7% updated it every two to four years and 4.1% did not update their plan.
- Urban municipal owners of roads (52%) were more likely to have an asset management plan than rural owners (38.1%).
- Canada had 125,000 kilometres of sidewalks in 2016. Over two-fifths of all sidewalks (43.9%) were reported to be in good or very good condition, while 8.5% of sidewalks were reported to be in poor or very poor condition. The average expected useful life of sidewalks was 35 years.
- There were 47,279 publicly owned bridges in 2016. Almost one-third (30.7%) of all bridges in Canada were in Ontario.
- From 1970 to 1999, 45.3% of highway bridges were completed — the highest proportion — followed by footbridges (43.8%), and arterial (34.9%), collector (34%) and local (33.4%) bridges. Just over one-third (34.8%) of tunnels were built over this period.
- The longest average expected useful lives of bridges were for bridges on highways (68 years), arterial roads (67 years) and collector roads (66 years). Local road bridges (48 years) and footbridges (51 years) were expected to be useful for the shortest average period.


Recent Comments