Tables 1 through 3 accompanying this article detail the latest (October 2018) statistics on construction employment regionally in the U.S. and Canada. Table 1 is a ranking of states, D.C. and Puerto Rico for the U.S. and provinces and territories for Canada by construction employment levels.

Table 2 is a ranking of states, D.C. and Puerto Rico for the U.S. and provinces and territories for Canada according to year-over-year (y/y) nominal changes in construction employment levels.
Table 3 is a ranking of states, D.C. and Puerto Rico for the U.S. and provinces and territories for Canada by y/y percentage changes in number of construction jobs.
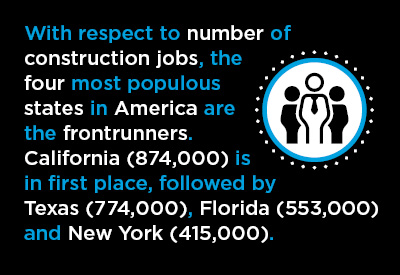
With respect to number of construction jobs (Table 1), the four most populous states in America are the frontrunners. California (874,000) is in first place, followed by Texas (774,000), Florida (553,000) and New York (415,000).
After New York, there’s a sizable step down to fifth-place Pennsylvania (266,000).
There are six other states with construction levels exceeding 200,000 – Illinois (243,000); Ohio (238,000); North Carolina (222,000); Washington (218,000); Georgia (+207,000); and Virginia (206,000).
(By the way, how populous are California, Texas, N.Y. and Florida? Combined, they account for the residences of one out of every three Americans.)
In Canada, Ontario (529,000 construction jobs) leads the pack by a wide margin. There is little separation, however, between the next three highest-ranking provinces – Quebec (253,000); Alberta (249,000) and British Columbia (237,000).
If one were to compare states and provinces, Ontario would be positioned in fourth spot, a little behind Florida but considerably ahead of New York.
| U.S. States – Construction Employment | |||
| Oct. 2018 – Not Seasonally Adjusted (NSA) data (3-month moving averages placed in latest month) |
|||
| Rank | State | No. of Workers | |
| 1 | California | 874,067 | |
| 2 | Texas | 774,267 | |
| 3 | Florida | 552,767 | |
| 4 | New York | 415,033 | |
| 5 | Pennsylvania | 265,600 | |
| 6 | Illinois | 243,333 | |
| 7 | Ohio | 238,400 | |
| 8 | North Carolina | 221,567 | |
| 9 | Washington | 218,433 | |
| 10 | Georgia | 206,700 | |
| 11 | Virginia | 206,067 | |
| 12 | Michigan | 186,433 | |
| 13 | Colorado | 176,167 | |
| 14 | Massachusetts | 169,333 | |
| 15 | Maryland | 166,000 | |
| 16 | Arizona | 165,900 | |
| 17 | New Jersey | 153,633 | |
| 18 | Indiana | 152,500 | |
| 19 | Louisiana | 149,600 | |
| 20 | Minnesota | 136,700 | |
| 21 | Wisconsin | 132,733 | |
| 22 | Missouri | 127,500 | |
| 23 | Tennessee | 125,333 | |
| 24 | Oregon | 112,567 | |
| 25 | Utah | 105,200 | |
| 26 | South Carolina | 98,900 | |
| 27 | Nevada | 94,533 | |
| 28 | Alabama | 88,333 | |
| 29 | Iowa | 86,100 | |
| 30 | Kentucky | 79,067 | |
| 31 | Oklahoma | 78,967 | |
| 32 | Connecticut | 66,633 | |
| 33 | Kansas | 62,933 | |
| 34 | Nebraska | 53,933 | |
| 35 | Arkansas | 53,733 | |
| 36 | Idaho | 50,133 | |
| 37 | New Mexico | 49,767 | |
| 38 | Mississippi | 43,600 | |
| 39 | West Virginia | 36,833 | |
| 40 | Hawaii | 36,433 | |
| 41 | Montana | 31,400 | |
| 42 | North Dakota | 30,867 | |
| 43 | New Hampshire | 30,800 | |
| 44 | Maine | 30,633 | |
| 45 | South Dakota | 25,433 | |
| 46 | Delaware | 23,833 | |
| 47 | Wyoming | 22,300 | |
| 48 | Rhode Island | 20,300 | |
| 49 | Puerto Rico | 19,833 | |
| 50 | Alaska | 17,267 | |
| 51 | Vermont | 16,733 | |
| 52 | District of Columbia | 16,267 | |
| Canadian Provinces – Construction Employment | |||
| Oct. 2018 – Seasonally Adjusted (SA) | |||
| Rank | Province | No. of Workers | |
| 1 | Ontario | 528,800 | |
| 2 | Quebec | 252,800 | |
| 3 | Alberta | 248,500 | |
| 4 | British Columbia | 237,400 | |
| 5 | Atlantic Region | 80,900 | |
| 6 | Saskatchewan | 50,700 | |
| 7 | Manitoba | 46,400 | |
Data for Canada’s northern territories is not available.
Table: ConstructConnect.
Moving on to Table 2, Texas (+54,000) has managed the biggest increase in number of construction jobs y/y, followed by Florida (+49,000) and California (+36,000). But Georgia (+21,000) and Arizona (+17,000) have surpassed New York (+15,000).
Mississippi, Puerto Rico, South Carolina and Kentucky have experienced minor drops of less than one thousand in construction employment. New Jersey, though, has seen a substantial decline (-6,900).
In Canada, Quebec (+6,500) has been the winner in nominal jobs creation, with B.C. (+5,400) in hot pursuit. Ontario’s performance (+1,200) has been relatively anemic.
| U.S. States – Nominal Change in Construction Employment | |||
| OCT. 2018 vs OCT. 2017 – Based on NSA Data | |||
| Rank | State | +/- No. of Workers | |
| 1 | Texas | 53,500 | |
| 2 | Florida | 49,400 | |
| 3 | California | 36,200 | |
| 4 | Georgia | 21,300 | |
| 5 | Arizona | 16,933 | |
| 6 | New York | 14,800 | |
| 7 | Michigan | 11,967 | |
| 8 | Washington | 10,833 | |
| 9 | Oregon | 10,167 | |
| 10 | North Carolina | 9,800 | |
| 11 | Nevada | 9,467 | |
| 12 | Indiana | 9,267 | |
| 13 | Virginia | 9,133 | |
| 14 | Massachusetts | 9,067 | |
| 15 | Ohio | 8,467 | |
| 16 | Wisconsin | 8,333 | |
| 17 | Illinois | 8,233 | |
| 18 | Colorado | 7,567 | |
| 19 | Minnesota | 6,700 | |
| 20 | Iowa | 5,867 | |
| 21 | Connecticut | 5,000 | |
| 22 | Pennsylvania | 4,167 | |
| 23 | Utah | 3,533 | |
| 24 | Tennessee | 3,100 | |
| 25 | New Hampshire | 3,067 | |
| 25 | New Mexico | 3,067 | |
| 27 | Idaho | 2,400 | |
| 28 | Alabama | 2,300 | |
| 29 | Louisiana | 2,200 | |
| 30 | Montana | 2,033 | |
| 31 | West Virginia | 1,933 | |
| 32 | Kansas | 1,633 | |
| 33 | Delaware | 1,567 | |
| 34 | Arkansas | 1,533 | |
| 35 | South Dakota | 1,433 | |
| 35 | Wyoming | 1,433 | |
| 37 | North Dakota | 1,400 | |
| 38 | Nebraska | 1,300 | |
| 39 | Rhode Island | 933 | |
| 40 | Maine | 900 | |
| 41 | Maryland | 833 | |
| 42 | District of Columbia | 633 | |
| 43 | Missouri | 467 | |
| 44 | Vermont | 333 | |
| 45 | Alaska | 200 | |
| 46 | Oklahoma | 133 | |
| 47 | Hawaii | 67 | |
| 48 | Mississippi | -67 | |
| 49 | Puerto Rico | -300 | |
| 50 | South Carolina | -700 | |
| 51 | Kentucky | -800 | |
| 52 | New Jersey | -6,900 | |
| Canadian Provinces – Nominal change in Construction Employment |
|||
| oct. 2018 vs oct. 2017 – Based on SA Data | |||
| Rank | Province | +/- No. of Workers | |
| 1 | Quebec | 6,500 | |
| 2 | British Columbia | 5,400 | |
| 3 | Alberta | 2,700 | |
| 4 | Ontario | 1,200 | |
| 5 | Saskatchewan | -500 | |
| 6 | Atlantic Region | -1,200 | |
| 7 | Manitoba | -1,600 | |
Data for Canada’s northern territories is not available.
Table: ConstructConnect.
From Table 3, there have been four states with double-digit y/y percentage jumps in construction employment – Georgia (+11.5%); Arizona (+11.4%); Nevada and New Hampshire (each +11.1%).
Table 3 includes a couple of extra features, − two horizontal lines, one dashed and the other solid. The jurisdictions lying above the dashed line have recorded percentage increases faster than for the whole construction sector nationwide (+4.7%).
The jurisdictions ‘north’ of the solid line have achieved percentage-change construction jobs growth that has been more rapid than the country-wide all-jobs advance of +1.7%. (‘All jobs’ is for construction, manufacturing and a multitude of services-related activities.)
To better see the dichotomy between jurisdictions above and below the solid vertical line, click on the following link, which will lead you to two maps – "Maps – Georgia Best and New Jersey Worst for Construction Jobs Growth".
In Canada, the regional percentage increases in construction employment have been nowhere near as outsized as in the U.S. Quebec (+2.6%) has done best, followed by B.C. (+2.3%) and Alberta (+1.1%).
Ontario (+0.2%), apparently wishing to take a breather, has stepped out of the parade. Manitoba (-3.3%) has packed up its gym bag and gone home for a nap.
| U.S. States – % Change in Construction Employment | |||
| oct. 2018 vs oct. 2017 – Based on NSA Data | |||
| Rank | State | % change No. of Workers | |
| 1 | Georgia | 11.5% | |
| 2 | Arizona | 11.4% | |
| 3 | Nevada | 11.1% | |
| 3 | New Hampshire | 11.1% | |
| 5 | Oregon | 9.9% | |
| 6 | Florida | 9.8% | |
| 7 | Connecticut | 8.1% | |
| 8 | Texas | 7.4% | |
| 9 | Iowa | 7.3% | |
| 10 | Delaware | 7.0% | |
| 11 | Michigan | 6.9% | |
| 11 | Montana | 6.9% | |
| 11 | Wyoming | 6.9% | |
| 14 | Wisconsin | 6.7% | |
| 15 | New Mexico | 6.6% | |
| 16 | Indiana | 6.5% | |
| 17 | South Dakota | 6.0% | |
| 18 | Massachusetts | 5.7% | |
| 19 | West Virginia | 5.5% | |
| 20 | Minnesota | 5.2% | |
| 20 | Washington | 5.2% | |
| 22 | Idaho | 5.0% | |
| 23 | North Dakota | 4.8% | |
| 23 | Rhode Island | 4.8% | |
| 25 | North Carolina | 4.6% | |
| 25 | Virginia | 4.6% | |
| 27 | Colorado | 4.5% | |
| 28 | California | 4.3% | |
| 29 | District of Columbia | 4.1% | |
| 30 | New York | 3.7% | |
| 30 | Ohio | 3.7% | |
| 32 | Illinois | 3.5% | |
| 32 | Utah | 3.5% | |
| 34 | Maine | 3.0% | |
| 35 | Arkansas | 2.9% | |
| 36 | Alabama | 2.7% | |
| 36 | Kansas | 2.7% | |
| 38 | Nebraska | 2.5% | |
| 38 | Tennessee | 2.5% | |
| 40 | Vermont | 2.0% | |
| 41 | Pennsylvania | 1.6% | |
| 42 | Louisiana | 1.5% | |
| 43 | Alaska | 1.2% | |
| 44 | Maryland | 0.5% | |
| 45 | Missouri | 0.4% | |
| 46 | Hawaii | 0.2% | |
| 46 | Oklahoma | 0.2% | |
| 48 | Mississippi | -0.2% | |
| 49 | South Carolina | -0.7% | |
| 50 | Kentucky | -1.0% | |
| 51 | Puerto Rico | -1.5% | |
| 52 | New Jersey | -4.3% | |
| Canadian Provinces – % change in Construction Employment |
|||
| oct. 2018 vs oct. 2017 – Based on SA Data | |||
| Rank | Province | % change No. of Workers | |
| 1 | Quebec | 2.6% | |
| 2 | British Columbia | 2.3% | |
| 3 | Alberta | 1.1% | |
| 4 | Ontario | 0.2% | |
| 5 | Saskatchewan | -1.0% | |
| 6 | Atlantic Region | -1.5% | |
| 7 | Manitoba | -3.3% | |
Figures for Delaware, D.C. and Hawaii include mining & logging as well as construction.
Data for Canada’s northern territories is not available.
Table: ConstructConnect.


Recent Comments
comments for this post are closed