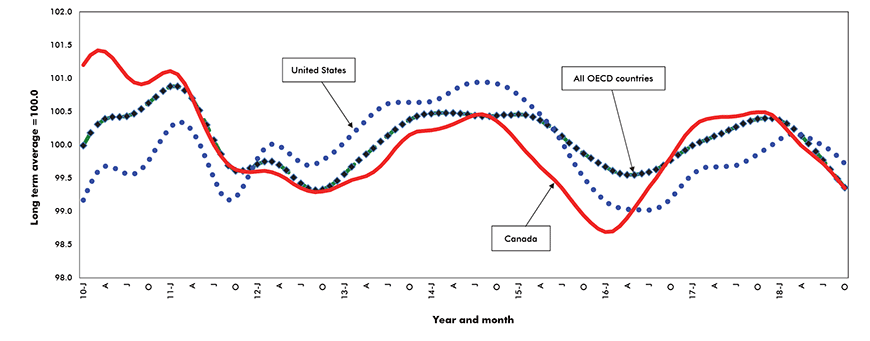
While not all national economies move in concert, the increase in international trade over the past 20 years has caused their business cycles to become increasingly interconnected and more global in nature. For this reason, we initially look to international organizations such as the International Monetary Fund (IMF) and the Organization for Economic Co-operation and Development (OECD) in order to obtain a global perspective on the near-term prospects of the global economy. Not surprisingly, since both organizations are looking at essentially the same global statistics, their near-term outlooks have a lot in common.
In its most recent World Economic Outlook released in October, the IMF observed that while global growth for 2019 is projected to remain in the range of 3.5% to 4%, the global expansion has become less balanced and growth may have peaked.
The preliminary version of the OECD’s Economic Outlook also observes that “growth has peaked” and that the global economy is “navigating rough seas”. Following estimated growth of 3.7% in 2018, the OECD sees the global economy growing by 3.5% in 2019 and 2020.
However, both organizations highlight the downside risks to the near-term outlook. These include a recent reversal of capital flows away from developing economies toward advanced ones, increased trade tensions (particularly between the United States and China) and the risk that higher U.S. inflation will cause monetary authorities to adopt a more restrictive policy stance leading to higher interest rates.
This prospect for slower global growth is reinforced by the OECD’s Composite Leading Indicator which, after hitting a near-term high of 100.4 in the final quarter of 2017, has trended steadily lower during the first nine months of 2018.
Since 1854, when the National Bureau of Economic Research started to keep track of them, the U.S. economy has experienced 33 business cycles. The expansion phase of these cycles has averaged just over 3 years, while contractions have lasted approximately 17.5 months.
Since World War II, U.S. business cycles have become more protracted and the 11 cycles the U.S. has experienced between then and now have lasted, on average, 48.4 months.
This background helps put the current economic expansion in perspective. It began in June of 2009 and so far it has lasted just over 9 years (111 months). This makes it the second longest expansion on record.
The longest, which stretched from 1991 to 2001, lasted 10 years. There are few indicators warning that the current expansion is going to end in the next six months.
However, its above-average age and the downside risks already outlined suggest there is a heightened possibility it could end in the next 12 to 18 months. Between now and then, the mixed pattern of the current medley of economic indicators signal “steady as she goes”.
The positive note struck by the U.S. Manufacturing PMI in November was partly offset by the Conference Board’s Leading Economic Index which posted a relatively modest 0.1% gain in October following back-to-back gains of 0.5% and 0.6% in the previous two months. This mixed message was reinforced by the U.S. Federal Reserve’s Quarterly Beige Bookwhich the Wall Street Journal’s Sharon Nunn headlined as “Growth is Good but Uncertainty is Climbing among U.S. Businesses”.
While the U.S. Federal Reserve reported that economic activity was continuing to increase across much of the U.S., the spectre of higher tariffs and rising interest rates has eroded confidence. This somewhat more subdued outlook for the U.S. is reinforced by the back-to-back declines in the Conference Board’s Help Wanted Online Index in October and November and the gradual deterioration in U.S. investor confidence reflected by the more than 350-point drop in the S&P 500 index since the beginning of October.
Given that the U.S. economy still has considerable momentum heading into 2019, it should continue to provide a tailwind to growth in Canada into the first half of the year at least. Also, although growth in Canada slowed from 2.9% q/q at annual rates in Q2 to 2.1% in Q3, a number of forward-looking indicators suggest it will continue to expand at a moderate pace over the near term.
First, after posting back-to-back declines in September and October, the IHS Markit Canada Manufacturing PMI increased from 53.9 to 54.9 in November, its highest print since August.
Second, demand for labour by the private sector as reflected by the CFIB’s Help Wanted Survey, hit a 14-year high in the third quarter. This gain was driven in part by a significant increase in the number of vacant jobs in the construction industry where the vacancy rate hit a 10-year high of 4.4%.
While the exceptionally strong job gain in November (+94K) was “out of the ball park” in terms of analysts’ expectations, it was consistent with the aforementioned increase in private sector job postings.
While hiring will probably cool in December, the fact that most of the job gains were full-time and in the private sector should support both consumer spending and residential construction well into the new year.
Despite this support, the outlook for growth in Canada remains subdued given the relatively hostile investment climate, reflected by the decline in foreign investment in Canadian securities and the spectre of higher taxes on energy-intensive industries, especially oil and gas extraction.
Following a gain of 3% in 2017, we estimate that the Canadian economy grew by 2.0% in 2018 and we expect it to grow by 1.5% to 2% in 2019.
OECD Composite Leading Indicators – All countries, United States and Canada

Chart: ConstructConnect — CanaData.


Recent Comments
comments for this post are closed