It’s a well-known fact that manufacturing employment in Canada has been in decline over the past decade-plus.
It’s a well-known fact that manufacturing employment in Canada has been in decline over the past decade-plus.
Products that last longer, a shift towards the greater use of robotics and that most talked-about factor of all, the outsourcing of work to often non-unionized and lower labour-cost locations in the southern U.S. and Asia, have all played contributing roles in reducing the number of production-line workers.
Ontario has always been the heartland of manufacturing in Canada.
Nearly half of the nation’s 33 largest population centres (a.k.a. census metropolitan areas or CMAs) are located in the province.
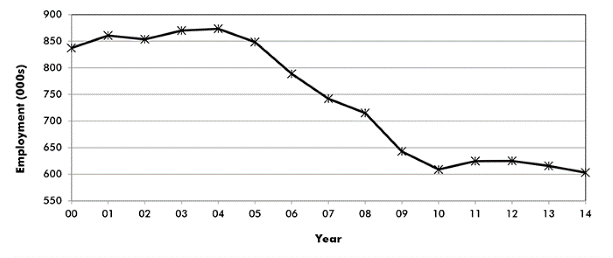
Graph 1 shows the history of manufacturing employment in those 15 Ontario cities since 2000.
The level crept upwards to a peak in 2004, after which it steadily declined until 2010. During the past five years, there has been an almost flat performance.
In the recent provincial election, a number of commentators spoke about a “great divide” between a still prosperous Toronto — which has remained vibrant thanks to its diversity in financial services, broadcasting, academia, etc. — and cities in the “hinterlands”, where job losses, especially in manufacturing, have brought suffering.
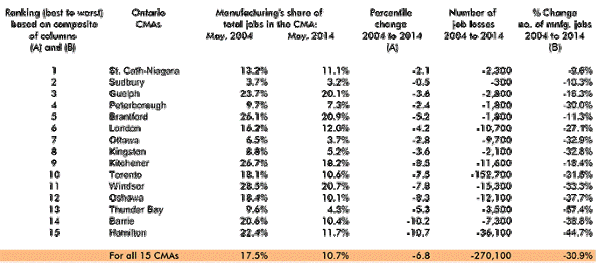
Focusing specifically on manufacturing, the table accompanying this report sheds light on this subject.
CanaData has ranked Ontario’s cities, from best to worst, based on a calculation that combines two measures.
It’s not enough to consider only the percentage decline in manufacturing employment, as shown in column (B), over the 11-year period, May 2004 to May 2014.
(To avoid the problem of seasonality, each year’s numbers in both the graph and table are for May only.)
An equally important factor is the extent to which manufacturing’s share of total employment in the city has plummeted. This is the percentile change that appears in column (A).
The need to combine the two measures can best be illustrated by considering two hypothetical situations.
For example, a 50% decline in manufacturing in one city may not be terribly significant if the sector accounted for only 5% of all jobs in the first place.
Elsewhere, a 10% drop in the number of manufacturing jobs will be a lot more important if manufacturing initially employed half the workforce.
One dramatic feature immediately jumps out from a quick look at columns (A) and (B).
There isn’t a single city in Ontario without a minus sign in front of both its percentage change and its percentile change.
Setting off a second alarm bell is the realization that the province’s bellwether city, Toronto, is two-thirds of the way down the list, with a 10th place ranking.
That’s not as good a showing as might have been expected.
Toronto’s total manufacturing employment decline of 153,000 has been slightly more than half of the 270,000-job loss for all 15 cities together.
Manufacturing’s share of total jobs in Toronto has also fallen significantly, from 18.1% in 2004 to only 10.6% at present.
While the sector’s jobs decline has impacted five cities in the province relatively more than Toronto, a higher number (9) have been less devastated.
To be continued in Economy at a Glance, Vol. 10, Issue 79.
For more articles by Alex Carrick on the Canadian and U.S. economies, please see his market insights. Mr. Carrick also has an economics blog.
Graph 1: Total number of manufacturing jobs in Ontario Table 1: Manufacturing jobs in Ontario’s 15 Census Metropolitan Areas (CMAs)


Recent Comments
comments for this post are closed