Aficionados of horror movies know there are certain things – e.g., the proximity of Frankenstein’s monster – that will cause ‘the villagers’ to pick up their pitchforks and charge into the woods for a confrontation. It’s widely understood that the ‘villagers’ are you and me.
Such works may be escapist fiction, but while basic safety and security will always be a primary concern in real life, there are other terrors in non-fiction that are equally likely to incite our concern and ire and they’re mainly economic – e.g., a scarcity of jobs or sky-high prices.
With respect to inflation and rapidly increasing price levels, this article looks at three products that for many people are essentials – rent, gasoline and coffee.
Charts 1 through 6 show the year-over-year percentage changes of the rent, gasoline and coffee sub-indices within the broader Consumer Price Index (CPI) data produced by the U.S. Bureau of Labor Statistics (BLS) and Statistics Canada.
In the U.S., media headlines immediately prior to Memorial Day Weekend carried the message that travelers taking to the roads were about to discover that a fill-up at the gas pump would cost them nearly one-third more than a year ago.
The stronger U.S. economy has been contributing to more demand for gasoline. According to the website, www.gasbuddy.com/charts, the average price of gasoline in America is now $3.00 USD per gallon. Last year at the same time, it was $2.40. The increase has been +25%.
In Canada, according to GasBuddy, petrol has moved up in price from $1.10 CAD per liter to $1.35 per liter over the past 12 months, a climb of +23%.
(Sidebar: since a U.S. gallon is 3.8 liters, the cost of a liter of gasoline in the U.S. is $3.00/3.8 = $0.79 in ‘greenbacks’, or about $1.00 in Canada’s currency. The fact the price of gasoline north of the border is considerably higher than to the south – due to a more pervasive array of government taxes − should be reason enough for Canadians to pick up their pitchforks.)
Production cuts by OPEC nations and Russia have lifted the international price of oil. On May 22nd, Brent crude from the North Sea burst above the $80 USD per-barrel barrier, before falling back a little. West Texas Intermediate (WTI) is today around $67 USD per barrel, a climb of about one-third from end-of-May 2017.
The steep ascents of the price of gasoline in both the U.S. and Canada began in mid-May of this year. There are ‘gasoline’ sub-indices within the broader CPI data. In April, the gasoline sub-index was +13.5% for the U.S. (Graph 1) and +14.2% for Canada (Graph 2). Keep in mind that there has been further price escalation from April to May.
In the U.S., analysts are pointing out that for many individuals, the financial benefits they have been realizing from the recent personal income tax reductions are being significantly negated by the increase in the price of gasoline.
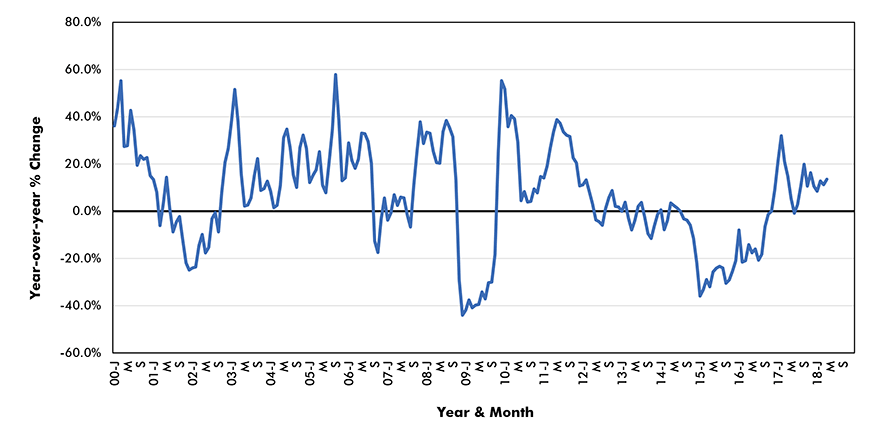
Chart: ConstructConnect.
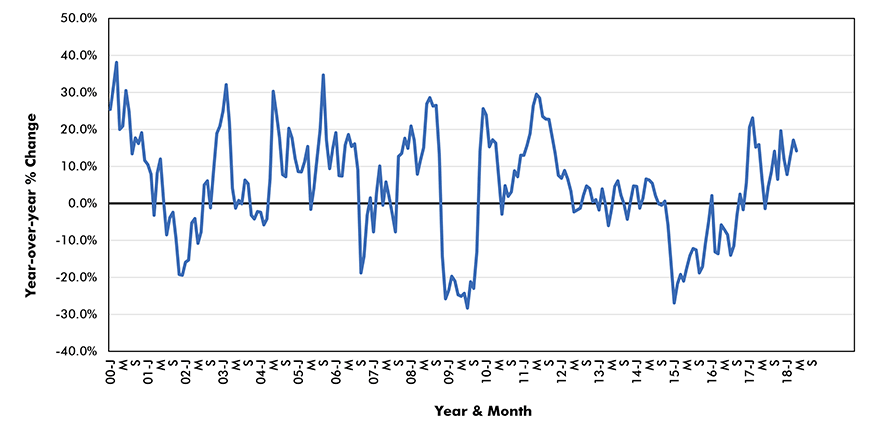
Chart: ConstructConnect.
From Graph 3, the cost of renting in the U.S. has risen to nearly +4.0% year over year. While that degree of increase is clearly more dramatic than several years ago, it’s not uniquely elevated. U.S. rental rates were climbing by more than +4.0% year-over-year in 2007 and 2001.
In Canada (Graph 4), according to the CPI sub-index, year-over-year rent increases have been relatively restrained. Dating back to 2000, they have never exceeded +2.0% for the national average.
There have been individual cities with more uplift. Toronto residents faced rent hikes of more than +3.0% annually in the early 00s. And in the latest CPI numbers, the ‘rental accommodation’ annual percent change is +1.6% for Toronto and +1.9% for Vancouver.
Legislation establishing rules for rent controls (i.e., timing and allowable increases) may be more prevalent in Canadian provinces than in American states. Ontario and B.C. are the provinces and California, New York, New Jersey, Maryland and Washington, D.C., are the states and districts that have historically adopted forms of rent control.
There are certainly implications for construction to be drawn from the gasoline and rent cost increases. Steep rent increases influence the geography of home building. They drive accommodation demand out of city cores in favor of home ownership in the suburbs.
But stiff hikes in the price of gasoline are a counterweight. Paying prohibitively more for motor vehicle fuel further diminishes the appeal of long commutes.
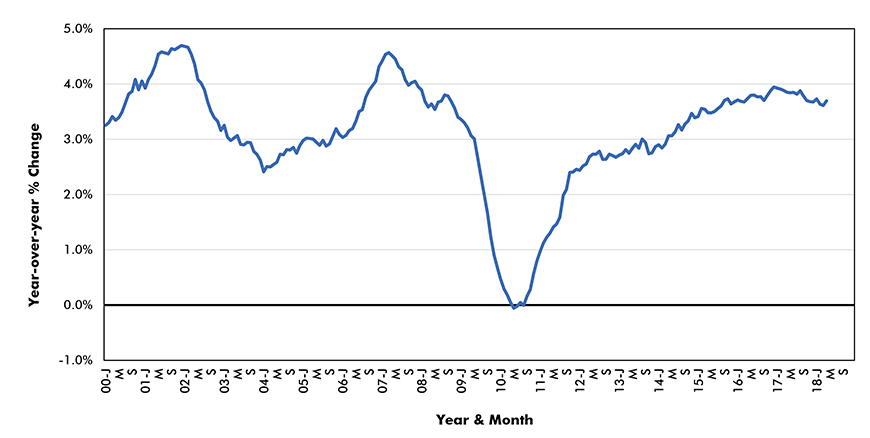
Chart: ConstructConnect.
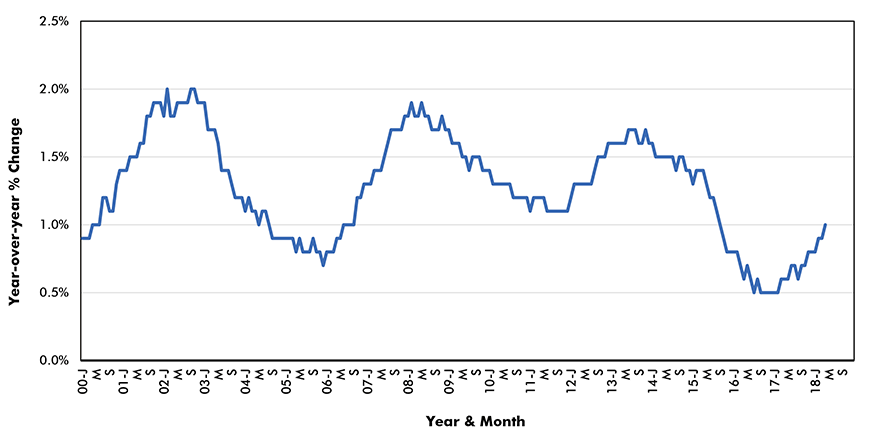
Chart: ConstructConnect.
Moving on to the third ‘essential’, coffee, consumers can at least be thankful they are receiving a break on that cost front. From Graphs 5 and 6, the price of coffee is -3.3% year over year in the U.S. and -1.5% in Canada.
One segment of society, however, may be worse off with low-priced coffee. Its bargain status promotes demand and coffee is a stimulant. There are those in the political class who won’t to see the populace get too riled up.
That might lead to the townsfolk gathering in the village square for a confab on what to do about the painful price-of-gasoline and cost-of-rent situations.
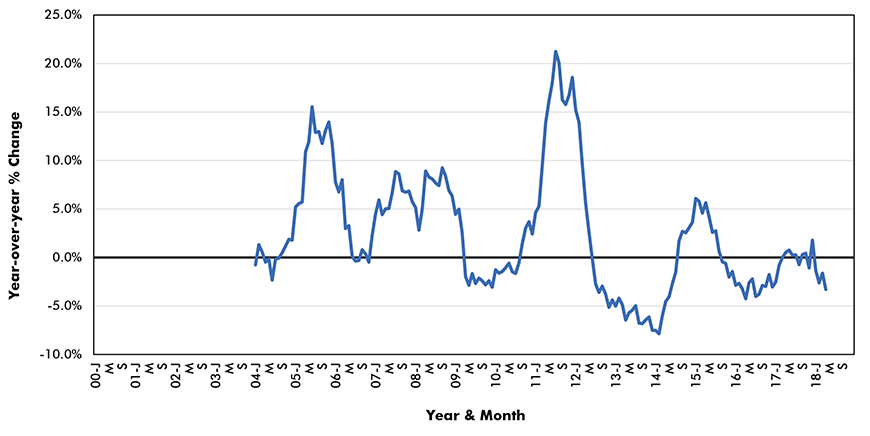
Chart: ConstructConnect.
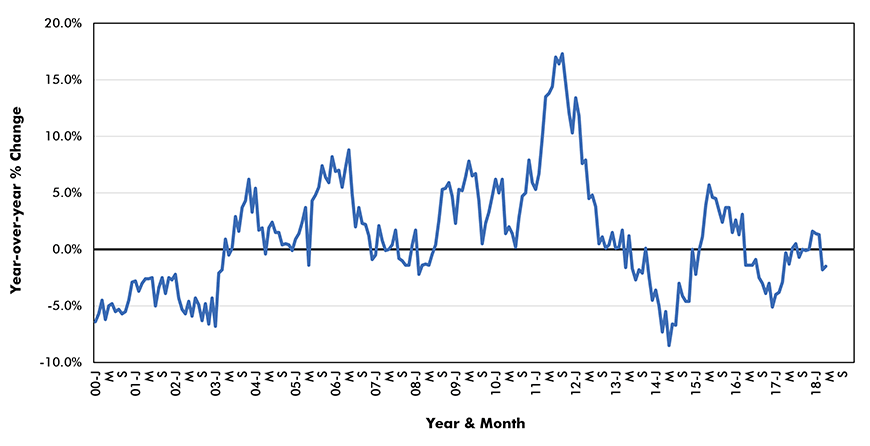
Chart: ConstructConnect.
See also the related infographic, “Infographic: U.S. and Canada Capacity Utilization Rates“.




Recent Comments
comments for this post are closed