The press release issued on the U.S. Producer Price Index (PPI) data calculated by the Bureau of Labor Statistics (BLS) highlights only a small subset of all the series generated. There is a much larger (i.e., 185-page) monthly report that features thousands of entries. Many of them pertain to construction.
This article is based on the fuller range of material contained in the bigger PPI report.
In calculating a price index for a good or service, the initial step is to choose a base period and set the real-world price at that time equal to 100.0. Then each subsequent monthly price is expressed as a ratio of that ‘base’ price. For example, if the real-world price rises by 8% in a year, its index value will advance to 108.0. If the real-world price drops by 2% in a year, its index value will recede to 98.0.
The PPI numbers are known as ‘factory-gate’ prices. They are what producers or providers charge for their goods or services when they ‘go out the door’. They do not include later transportation or wholesaling fees. (Transporters and wholesalers have their own ‘factory-gate’ prices.) They do include material, labor and margins.
The PPI series are limited to dom and estic sources. Imports of equivalent products are not covered. Some imports, augmented by tariffs, however, will appear indirectly in the material component of factory-gate prices.
Accompanying Table 1 has three sections. The top portion focuses on ‘final demand’ prices for all construction; for ‘private’ versus ‘public’ construction; and for five type-of-structure categories. ‘Final demand’ reflects the prices paid by owners for the construction of their projects.
The middle (unshaded) section is for services, commodities (materials) and energy components essential for construction.
The bottom block bundles goods and services as ‘inputs’ into specific kinds of construction. These are the costs − exclusive of capital investment (i.e., machinery and equipment purchases), final-stage labor and final-stage imports − faced by contractors.
The year-over-year (y/y) price movements for ‘final demand’ construction at the top of Table 1 remain reasonably restrained. Total construction in July was only +3.2% y/y, with private capital works (+3.5%) advancing a little quicker than public/government works (+2.9%).
The ‘final demand’ price advances for the five type-of-structure categories highlighted in the upper section of Table 1 range from a low of +2.6% for warehouses to +3.8% for office buildings.
The ‘input’ indices at the bottom of Table 1, however, tell quite a different story.
% Change in the July 2018 Index from:
| 3 Years | 1 Year | 6 months | 3 months | 1 month | |||||
| Ago | Ago | Ago | Ago | Ago | |||||
| Final Demand/Service/Commodity/Energy/Input: | |||||||||
| Final Demand Construction | 7.4% | 3.2% | 1.8% | 0.6% | 0.4% | ||||
| Construction for private capital investment | 7.6% | 3.5% | 2.0% | 0.8% | 0.5% | ||||
| Construction for Government | 6.8% | 2.9% | 1.6% | 0.3% | 0.4% | ||||
| New warehouse building construction | 8.0% | 2.6% | 1.2% | 0.7% | 0.3% | ||||
| New school building construction | 7.1% | 3.1% | 1.7% | 0.1% | 0.4% | ||||
| New office building construction | 8.0% | 3.8% | 2.2% | 1.0% | 0.5% | ||||
| New industrial building construction | 7.6% | 3.5% | 1.9% | 0.9% | 0.7% | ||||
| New health care building construction | 6.8% | 3.3% | 2.0% | 0.6% | 0.4% | ||||
| Architectural & engineering services | 6.7% | 2.7% | 0.9% | 0.3% | 0.4% | ||||
| Construction machinery & equipment | 1.1% | -0.6% | 0.8% | 0.2% | 0.0% | ||||
| Asphalt | 15.2% | 44.9% | 54.1% | 33.4% | 7.0% | ||||
| Plastic construction products | 5.2% | 4.7% | 2.0% | 0.0% | -0.2% | ||||
| Softwood lumber | 35.2% | 19.5% | 14.2% | 7.9% | -2.5% | ||||
| Hardwood lumber | 7.9% | 6.1% | 3.4% | 0.5% | -1.9% | ||||
| Millwork | 10.8% | 5.8% | 4.2% | 2.4% | 0.2% | ||||
| Plywood | 23.1% | 22.5% | 10.6% | 2.6% | 1.1% | ||||
| Particle board & oriented strandboard (OSB) | 41.0% | 15.5% | 18.2% | 7.9% | 4.3% | ||||
| Gypsum | 17.2% | 4.1% | 3.0% | -2.9% | 1.3% | ||||
| Insulation materials | 4.6% | 2.0% | 0.9% | -0.1% | -0.2% | ||||
| Construction sand, gravel & crushed stone | 11.9% | 3.6% | 2.1% | 0.8% | 0.7% | ||||
| Cement | 13.0% | 2.3% | 1.5% | 1.2% | 0.6% | ||||
| Ready-mix concrete | 11.5% | 3.9% | 1.8% | -2.7% | -1.5% | ||||
| Precast concrete products | 8.2% | 3.8% | 2.7% | 1.6% | 0.4% | ||||
| Prestressed concrete products | 19.2% | 4.8% | 4.2% | 3.6% | -0.2% | ||||
| Brick (clay) | 2.8% | 1.7% | 0.3% | -0.3% | -0.3% | ||||
| Coal | 4.6% | 3.8% | 1.8% | 0.6% | -0.6% | ||||
| Iron ore | 7.0% | 2.8% | 17.7% | 6.4% | -1.4% | ||||
| Iron & steel scrap | 44.0% | 25.2% | 9.1% | -3.1% | -0.8% | ||||
| Steel bars, plates & structural shapes | 14.2% | 18.1% | 19.5% | 7.5% | 0.5% | ||||
| Steel pipe & tube | 27.5% | 16.6% | 14.6% | 3.9% | 2.1% | ||||
| Fabricated structural metal products | 9.8% | 8.8% | 6.2% | 2.6% | -0.8% | ||||
| Prefabricated Metal Buildings | 20.0% | 12.8% | 12.3% | 3.5% | 1.8% | ||||
| Metal valves | 8.6% | 4.1% | 3.3% | 0.4% | 0.0% | ||||
| Aluminum mill shapes | 24.2% | 17.8% | 10.7% | 4.0% | -3.0% | ||||
| Sheet metal ducting | 2.3% | 0.2% | 0.1% | 0.0% | 0.0% | ||||
| Flat glass | 8.0% | 2.9% | 1.0% | -0.1% | -0.4% | ||||
| Paints, architectural coatings | 6.0% | 4.2% | 2.5% | 1.3% | 0.4% | ||||
| Lighting fixtures | 4.2% | 2.3% | 1.3% | 1.2% | 1.2% | ||||
| Plumbing fixtures & fittings | 4.9% | 2.4% | 1.3% | -0.1% | 0.0% | ||||
| Elevators & escalators | 6.3% | 2.2% | 0.5% | 0.3% | 0.0% | ||||
| Heating equipment | 7.7% | 5.4% | 3.2% | 3.2% | 0.3% | ||||
| Air conditioning equipment | 7.9% | 4.6% | 2.6% | 2.0% | 0.4% | ||||
| Copper wire & cable | 13.1% | 12.8% | 6.5% | 8.3% | 3.8% | ||||
| Fiber optic cable | 0.3% | 0.2% | 0.2% | 0.0% | 0.0% | ||||
| Regular gasoline unleaded | 5.3% | 40.7% | 21.2% | 10.6% | 0.4% | ||||
| Diesel Fuel | 32.9% | 43.6% | 12.4% | 11.8% | -1.6% | ||||
| Jet Fuel | 22.3% | 54.7% | 11.7% | 9.5% | -2.4% | ||||
| Natural gas | -1.8% | -6.7% | -4.6% | 18.7% | 3.7% | ||||
| Natural gas to electric utilities | 5.0% | -3.7% | 3.6% | 3.8% | -0.3% | ||||
| Commercial electric power | 1.2% | 0.0% | 6.0% | 7.2% | -1.5% | ||||
| Industrial electric power | 8.3% | 1.5% | 5.6% | 7.9% | -0.8% | ||||
| Residential electric power | 3.9% | 0.9% | 3.3% | 4.2% | -0.3% | ||||
| Commercial natural gas | 6.5% | -1.4% | -4.3% | -2.7% | 0.3% | ||||
| Industrial natural gas | 0.5% | -4.4% | -4.2% | -1.2% | 0.3% | ||||
| Residential natural gas | 6.1% | -1.7% | -2.3% | -1.8% | 0.8% | ||||
| Inputs to new construction | 9.5% | 8.1% | 4.8% | 2.1% | -0.1% | ||||
| Inputs to new construction, goods | 9.7% | 9.4% | 5.7% | 2.8% | -0.2% | ||||
| Inputs to new construction, services | 9.5% | 6.4% | 3.6% | 1.2% | 0.1% | ||||
| Inputs to new residential construction | 10.1% | 8.1% | 4.8% | 2.1% | 0.3% | ||||
| Inputs to single-family res construction | 10.4% | 7.9% | 4.7% | 2.2% | 0.3% | ||||
| Inputs to multi-family res construction | 10.7% | 8.3% | 5.5% | 2.2% | 0.2% | ||||
| Inputs to new non-res construction | 8.5% | 8.0% | 4.7% | 2.1% | -0.4% | ||||
| Inputs to commercial construction | 9.2% | 7.8% | 4.8% | 2.0% | -0.5% | ||||
| Inputs to healthcare structures | 8.8% | 7.4% | 4.6% | 2.0% | -0.4% | ||||
| Inputs to industrial structures | 6.4% | 5.6% | 2.9% | 1.0% | -0.6% | ||||
| Inputs to highways & streets | 9.4% | 9.6% | 5.8% | 2.4% | -0.3% | ||||
| Inputs to power & communication structures | 8.3% | 8.1% | 4.7% | 2.1% | -0.4% | ||||
| Inputs to educational & vocational structures | 9.0% | 7.2% | 4.4% | 1.7% | -0.4% | ||||
| Inputs to maintenance & repair construction | 8.9% | 8.2% | 4.8% | 2.2% | 0.0% | ||||
| Construction materials (PPI ‘Special Index’) | 12.4% | 8.3% | 6.4% | 3.2% | 0.1% |
The ‘service’, ‘commodity’ and ‘energy’ indices (in the middle section of the table) are based on ‘factory-gate’ sales prices.
The ‘input’ indices (at bottom) reflect costs faced by contractors. They exclude capital investment (i.e., machinery & equipment), labor & imports.
The ‘input’ indices are built up from the ‘service’ (design, legal, transport & warehousing, etc.) ‘commodity’ and ‘energy’ indices.
Table: ConstructConnect.
PPI Construction ‘Input’ costs Rising Rapidly
While the PPI’s ‘final demand’ construction price indices (top section of Table 1) are still being held in check, the ‘input’ indices (bottom section of Table 1) are rapidly shifting to higher ground.
The PPI’s ‘inputs to new construction’ index is presently +8.1% y/y. The ‘goods’ component of those inputs is +9.4%; the ‘services’ component, +6.4%.
The other y/y price increases in the bottom portion of Table 1 are also displaying notable large jumps.
Inputs to new residential construction are +8.1% y/y, with multi-family housing (+8.3%) a stride or two in front of single-family housing (+7.9%).
Inputs to new nonresidential construction are +8.0%, with type-of-structure sub-categories ranging from a low of +5.6% for industrial buildings to a high of +9.6% − i.e., a nearly double-digit percentage increase − for ‘highways and streets’. (The PPI ‘commodity’ price index y/y for Asphalt in July was +44.9%.)
The PPI’s latest ‘inputs to maintenance and repair construction’ index in July was +8.2% y/y.
Also included in the PPI data is a ‘special index (SI)’ for ‘construction materials’ and its most recent performance was +8.3% y/y.
Graph 1 shows the monthly y/y percentage-change history, January 2000 to the present, of the ‘goods inputs to new construction’ index. Since September 2015, almost three years ago, the figure has shot up from -5.1% to close to +10.0% most recently.
The cost index for ‘goods inputs into construction’ is now racing ahead at its fastest rate since September 2008’s +12.4%. But that elevated rate of +12.4% a decade ago resulted from an artificial boom in homebuilding that was fueled by faulty sub-prime mortgage lending. When those risky underwritings failed, and the Great Recession took hold, the ‘goods inputs to new construction’ price index collapsed to -8.2% in the summer of 2009.
Graph 1: Inputs to U.S. New Construction, Goods (PPI Index)
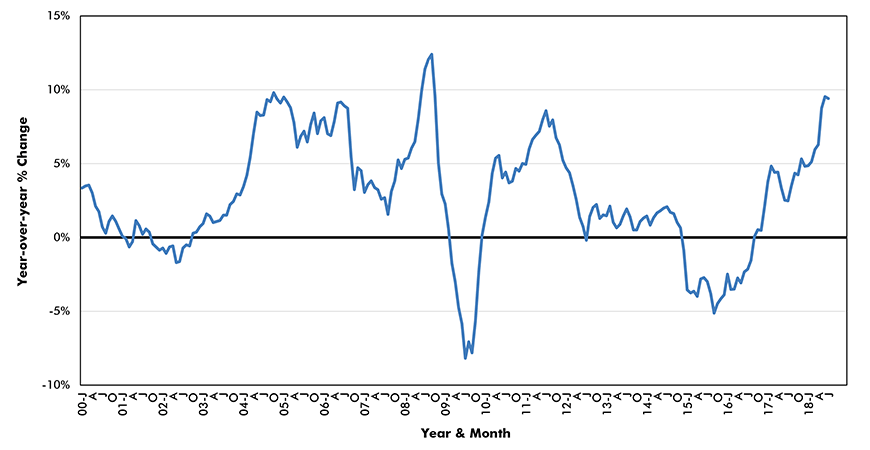
Chart: ConstructConnect.
Read the related articles: “Costs of Service, Commodity and Energy Inputs Into Construction Are Heating Up“; “Canada’s Construction Material Costs +6.6% Y/Y in July” and ““Infographic: Construction is costing more“.







Recent Comments
comments for this post are closed