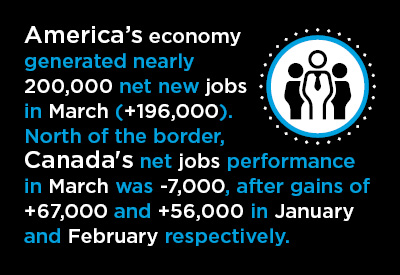
In February, Canada had a strong record of jobs creation while the U.S. faltered; but for the latest month now on record, March 2019, the opposite was the case. According to the just-issued Employment Situation report from the Bureau of Labor Statistics (BLS), America’s economy generated nearly 200,000 net new jobs in March (+196,000).

North of the border, the net jobs performance in March, according to Statistics Canada, was -7,000, after gains of +67,000 and +56,000 in January and February respectively.
Both countries maintained the same unemployment rates as in the month prior, 3.8% for the U.S. and 5.8% for Canada. (The methodology used to calculate Canada’s number isn’t as tight as it is for the U.S.). On a historical basis, the jobless rates for both the U.S. and Canada are quite low.
Through the first quarter of 2019, the average monthly gain in U.S. employment has been +180,000 jobs, a commendable level of advance, although down by a fifth from 2018’s January-March super-charged average of +228,000.
Canada’s average monthly jobs climb through Q1 2019 has been +39,000. At the same time last year, Canada’s total employment had retreated by -7,000 as a monthly average through March.
U.S. Jobs Growth by Industry Sector:
Construction employment in the U.S. in March was +16,000 jobs, which was also the monthly average for the first quarter of this year. The monthly average in Q1 2018 had been +36,000.
The not seasonally adjusted (NSA) unemployment rate for construction in March of this year was a measly 5.2%, an impressive improvement over the 7.4% figure of a year ago.
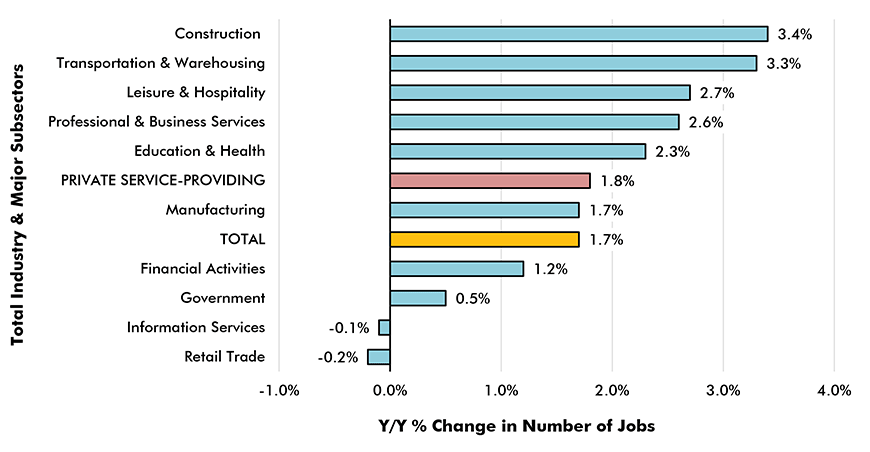
As shown in Graph 1, construction continued to lead all major industrial sectors in year-over-year (y/y) employment growth in the latest month, at +3.4%. The y/y jobs pickup in ‘transportation and warehousing’ was almost as fast, +3.3%.
In nominal terms, the largest U.S. jobs increases in March came in ‘education and health services’ (+70,000 jobs), ‘professional and business services’ (+37,000) and ‘leisure and hospitality’ (+33,000).
The increase in ‘education and health’ staffing was dominated by ‘health care and social assistance’ (+61,000). Hospital payrolls rose by +14,000 jobs.
U.S. ‘retail’ (-12,000) and ‘manufacturing’ (-6,000) employment contracted in March.
Graph 1: Y/Y Jobs Growth, U.S. Total Industry & Major Subsectors −
March 2019 (based on seasonally adjusted payroll data)

Chart: ConstructConnect.
Hourly and Weekly Earnings:
While the supply of labor in the U.S. may be stretched, and there have been some months over the last couple of years when compensation rates have appeared ready for a take-off, March 2019 was not one of the them.
Whether for ‘all jobs’ or construction jobs alone, and including or excluding supervisory personnel (i.e., bosses), y/y hourly and weekly compensation rates in the U.S. in March were in a range of +3.0% to +3.6%. Earnings hikes will need to consistently reach +4.5% y/y or more before worries about inflation become mainstream.
Graph 2: Average Weekly Earnings Y/Y – ‘All Jobs’ and Construction

Chart: ConstructConnect.
Canada’s Labour Market:
In Canada, in March, the construction sector shed 2,000 jobs. There have been small reductions (i.e., never more severe than -15,000) in ‘hard hat’ employment in 11 of the past 15 months in the land of maple leaves and Mounties.
Canada’s manufacturing sector added 5,000 jobs in March, bringing the sector’s monthly average for this year to +1,000. Plus-a-thousand may sound unexciting, but at least it’s better than last year’s comparable number of -7,000.
With respect to y/y jobs creation, Canada has fallen behind the U.S. in both construction (-0.8% versus +3.4%) and manufacturing (+0.1% compared with +1.7%), but it has made up ground in the services sector (+2.2% relative to +1.8%). As a result, Canada’s y/y total jobs increase of +1.8%, has been a little ahead of America’s +1.7%.
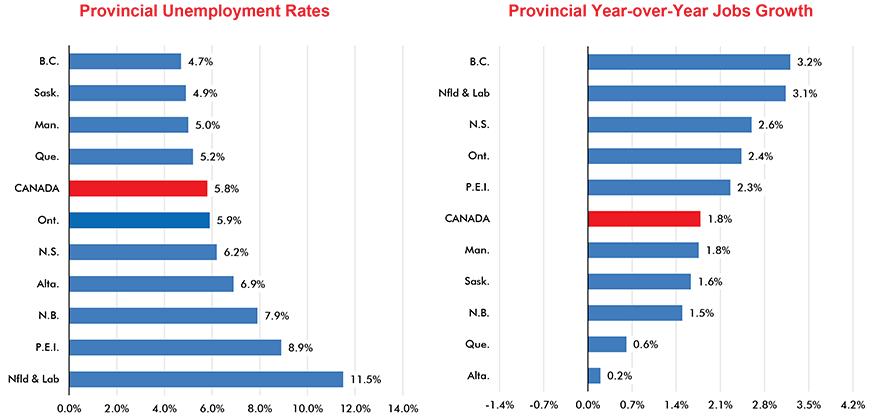
Regionally, B.C. (4.7%) currently has the lowest unemployment rate among all provinces. There are only three other provinces with jobless rates below the national average of 5.8%: Saskatchewan, 4.9%; Manitoba, 5.0%; and Quebec, 5.2%. Notice that three of the four provinces with the best unemployment rates are in the West.
B.C. is also leading the nation in y/y jobs growth, at +3.2%. As for the other four provinces with employment improvements better than the Canada-wide rate (+1.8%), three of them are in the Atlantic region: Newfoundland and Labrador (+3.1%); Nova Scotia (+2.6%); and Prince Edward Island (+2.3%). Ontario (+2.4%) has also been assembling noteworthy jobs gains.
Graph 3: Canada’s Labour Market – March 2019

The goal is for a high year-over-year (y/y) jobs growth rate.
Chart: ConstructConnect.


Recent Comments
comments for this post are closed