Canadian total employment shot up by +106,000 jobs in April, and the nation’s unemployment rate declined to 5.7%, according to the latest Labour Force Survey findings from Statistics Canada.

March’s jobless rate had been 5.8%. The month-to-month improvement in the out-of-work proportion would have been greater if not for the fact that the ‘participation rate’ climbed from 65.7% to 65.9% between the third and fourth months of this year. (A higher participation rate means that more people are actively on the hunt for jobs.)
The average monthly gain in total employment in Canada through the first third of 2019 has been +55,000, a robust hike. From January to April of last year, the average monthly change in the total Canadian jobs count was -2,000.
Since April 2018, total employment in Canada has risen by +426,000 jobs, a notable achievement.
April 2019’s +107,000 month-to-month increase in jobs was led more by full-time (+73,000) than part-time (+34,000) work. Also, it originated more in the private (+84,000) than the public (+23,000) sector.
The demographic cohort known as ‘youth employment’ – i.e., those aged 15 to 24 – had an especially good month on the jobs front in April. Employment among the young in the latest month rose by +47,000. Furthermore, the jobless rate for this grouping fell to its lowest level on record, dating back to 1976. (The current unemployment rate for 15-to-24-year-olds still sounds high at 10.6%.)
Canadian Construction versus Manufacturing Employment
Canadian construction employment, which saw month-to-month declines in seven of the preceding nine months, suddenly ‘caught fire’ in April with a +29,000 jobs advance. Year-to-date monthly average hiring in the sector, however, remains unremarkable, at +3,000.
Canadian manufacturing employment in April increased by +5,000 jobs. Manufacturing’s monthly payroll rise on average so far this year has been +2,000, which is better than last year’s comparable figure of -6,000.
The total number of construction jobs in Canada now, expressed as a ratio of the total number of manufacturing jobs, is 0.84. To understand the enormous relative shift in Canadian employment towards construction and away from manufacturing, consider that in 2000, the same ratio calculation yielded a figure of only 0.36.
Where there used to be three manufacturing jobs to every one construction job, there are now 1.2 manufacturing jobs to every one construction job.
Canadian Workforce Wages and Earnings
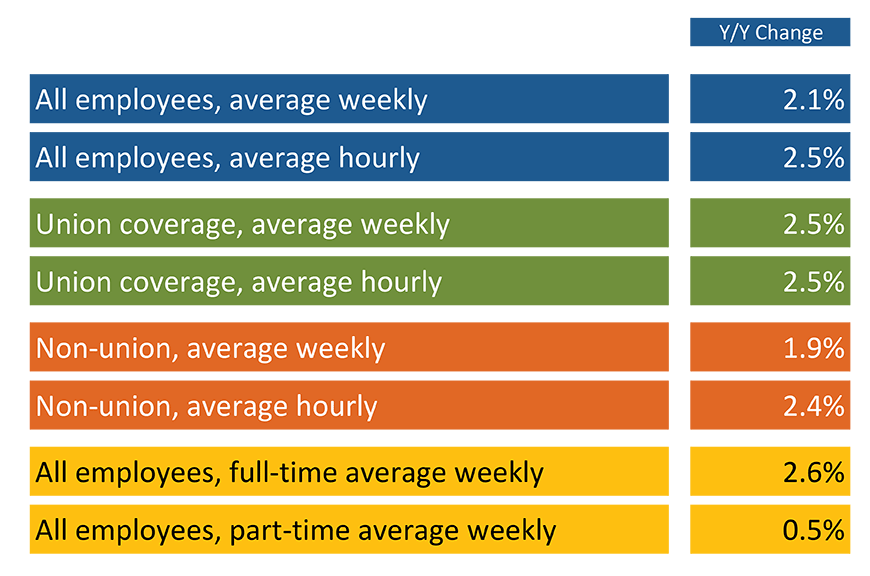
Table 1 below shows year-over-year earnings results for the Canadian workforce in April. (The numbers are derived from Table 11 of Statistics Canada’s latest Labour Force Survey report.)
There are no shocking results to highlight. Almost all the year-over-year (y/y) advances, both weekly and hourly, have been in a range of +2.0% to +2.5%. The only anomaly appears in average weekly earnings of part-time workers, an unrewarding +0.5%.
It should be mentioned, however, that earnings growth in Canada is only barely keeping ahead of inflation. The latest (March) y/y climb in the Canadian all-items Consumer Price Index was +1.9%.
Table 1: Canadian Workforce Earnings,
Year over Year – April 2019

(‘Current’ means no scaling back due to inflation.)
Chart: ConstructConnect.
Canadian Provincial Jobs Markets
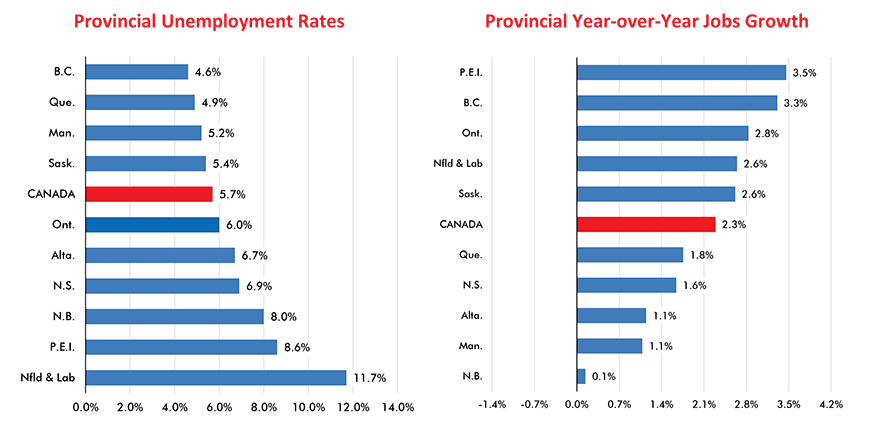
Table 2 below shines a spotlight on British Columbia and Saskatchewan as the best labour markets in the country presently. They are the only provinces satisfying two criteria. They possess both an unemployment rate that is lower than the national average and a y/y jobs increase rate that is faster than the national average.
Graph 1 ranks the provinces according to unemployment rates (lowest to highest) and jobs growth (faster to slower). Besides B.C. (4.6%) and Saskatchewan (5.4%), Quebec (4.9%) and Manitoba (5.2%) have unemployment rates lower than the ‘total Canada’ figure (5.7%).
As for y/y jobs growth, Prince Edward Island (+3.5%), Ontario (+2.8%) and Newfoundland and Labrador (+2.6%) join B.C. (+3.3%) and Saskatchewan (+2.6%) in the tier above the Canada-wide rate (+2.3%).
Table 2: Canada’s Provincial Labour Markets − April, 2019

Chart: ConstructConnect.
Graph 1: Canada’s Labour Market – April 2019

Chart: ConstructConnect.


Recent Comments