While it hardly seems academically acceptable, maybe the best way to describe the current economic environment at home and around the world is to label it ‘weird’.
There are inverted yield curves everywhere, negative interest rates in Europe (i.e., banks are paying companies and individuals to take out loans), housing demand remains soft, automotive sales have plateaued, the manufacturing sector is in retreat (see point (2) below), a trade/tariff war remains ongoing between America and China, and yet major U.S. stock market indices are within striking distance of their all-time highs.
The following ‘nuggets’ will help shed a little light on what is truly going on.
(1) America’s Construction Scene has Shifted to Mega Projects
ConstructConnect has calculated the total value of construction starts to date this year to be just over half a trillion dollars ($516.2 billion). Compared with the same January-to-August period of last year, the dollar volume is -3.3%.
What’s most interesting, however, is how the five major sub-categories of the grand total have performed. There have been year-to-date declines in residential (-12.1%), commercial (-11.7%) and institutional (-5.9%). Almost compensating on the plus side have been industrial (+68.1%) and heavy engineering/civil (+5.7%). The industrial and engineering strength has been inordinately centered in ultra large projects.
Ultra large, or ‘mega’, projects are usually considered to involve capital spending of $1 billion or more each. The record of mega project initiations in 2019 has been remarkable. In the first eight months of 2018, there were groundbreakings on 13 mega projects with a combined value of $35.4 billion. From January through August of this current year, there have been start-ups on 24 mega projects with a sum of $92.5 billion. The mega project total so far in 2019 has been more than two-and-a-half times as great as in 2018.
Industrial ‘mega’ project work has included some new production-line facilities, but it is tending more towards energy projects, such as oil refineries, LNG plants and ethane crackers.
Engineering mega projects have been sprouting in the fields of rapid transit, electric power and railroad construction, with more such work to come.
(2) U.S. Construction is Still Recovering
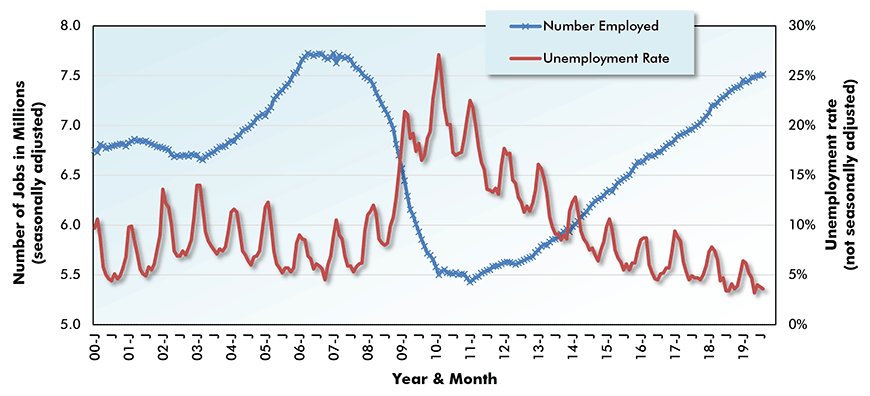
It may come as a shock, but there’s a sense in which U.S. construction is still recovering from the recession. At first glance, Graph 1 looks terrific for the industry. Employment has done nothing but shoot up since January 2011 and the unemployment rate of ‘hard hat’ workers is as low as it ever becomes.
It’s odd, though, that the total number of jobs in construction still isn’t as high as it was in 2005-2006. In January 2006, a boom in housing starts took the number of residential groundbreakings to 2.3 million units (annualized). Since then, the best figure that’s been achieved is 1.3 million units, on several occasions in 2017 and 2018. July 2019’s result was 1.2 million units.
The jobs count in nonresidential building construction is now about even with its previous summit from before the recession. In engineering construction, it’s 10% higher, but in residential, it still has a lot of catching up to do (-15%).
Graph 1: U.S. Construction Employment (SA) & Unemployment Rate (NSA)
Data source:Bureau of Labor Statistics/Chart: ConstructConnect.
(3) Surprising Explanation for Wage Differentials, ‘All Jobs’ vs Construction
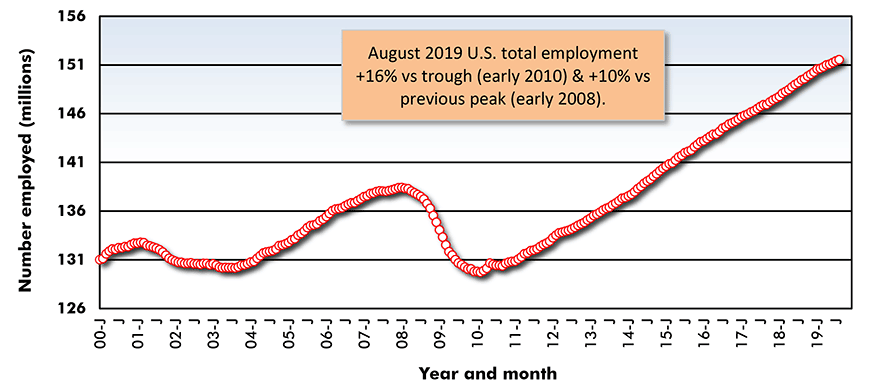
U.S. construction employment has not been typical of ‘all jobs’ employment. As of this August, the total jobs count in the U.S. economy was +16% compared with its trough level in early 2010 and +10% relative to its previous peak amount in early 2008 (see Graph 2).
Construction jobs have been in recovery. The ‘all jobs’ level, by way of contrast, has moved well beyond recovery into expansion. Perhaps this helps explain why construction wages, despite the severe shortages of available skilled manpower that are being reported in the industry, have not been outstripping ‘all jobs’ compensation performances.
On a year-over-year basis in August, U.S. ‘all jobs’ earnings gains were +3.5% hourly and +2.9% weekly, whereas construction workers had to make do with +2.5% both hourly and weekly.
Graph 2: U.S. Total Employment – Level
(Based on seasonally adjusted data)
(4) U.S. Manufacturing’s Doldrums
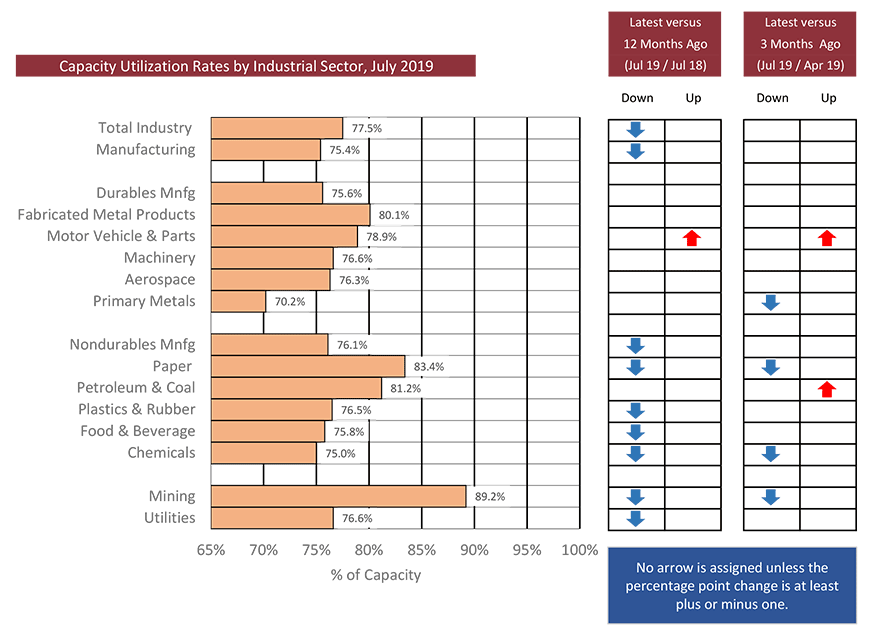
For the first time in a long while, the Purchasing Managers’ Index (PMI) of the Institute for Supply Management (ISM) fell below 50% in its latest reading, meaning that while the economy is still expanding, manufacturing activity is in contraction. This should be no surprise, given the sorry state of capacity utilization rates in the sector.
Graph 3 shows July 2019 capacity utilization rates for total industry, total manufacturing and several key sub-sectors of manufacturing, as estimated by the Federal Reserve. Both total industry and total manufacturing are currently operating at less than 80% of capacity. History has shown that firms won’t normally begin to consider expanding their production capabilities (i.e., their physical footprints or square footage) until their operations are at 80% of capacity or higher.
In these days of just-in-time inventory, the benchmark may rather be 85%-plus.
There are 16 arrows in the chart depicting how present capacity utilization rates compare with either three months ago or a year ago. (No arrow has been assigned unless the percentage change has been plus or minus one.) Thirteen of the sixteen arrows point downwards, to only three indicating uplift.
Graph 3: U.S. Industrial Capacity Utilization Rates − July 2019
(5) Stalemate in U.S.-China Trade War
America’s tariff war with China still hasn’t done much to reduce the size of the U.S. foreign trade deficit. In the latest reporting month (July 2019), the U.S. goods and services trade balance was -$648 billion (annualized). The ‘goods’ portion was -$884 billion, which was only partially redeemed by a ‘services’ surplus of +$236 billion.
China’s share of the overall U.S. trade deficit, however, did shrink in August. It now sits at 38% compared with a usual 45% to 50%. Other countries and trading blocs have stepped into the breach. Europe’s portion of the U.S. trade deficit has risen to 20%. Mexico’s is at 9%; Japan’s at 7%; and the rest of the world, 26%.
Excessive imports of foreign oil used to account for much of the U.S. trade deficit. That problem has been almost eliminated with the ramping up of U.S. crude production from shale rock deposits. U.S. total oil imports year to date in 2019 have been -11%. Imports from OPEC nations are -41%. From Saudi Arabia, they’re -30%.
An embargo on Venezuelan product has seen imports from that nation fall below purchases from Russia, although even when combined, they account for only 4.0% of total imports.
Canada continues to be the standout among U.S. outside oil suppliers. Barrels of imports from Canada are +6.3% year to date and Canada’s share of total imports has risen to 55%. Mexico is way back in second place for share at 8.5%. Canada can supply the ‘heavy’ crude that is now being denied entry from Venezuela.
Graph 4: United States’ Foreign Trade: Goods and Services Balance − July 2019
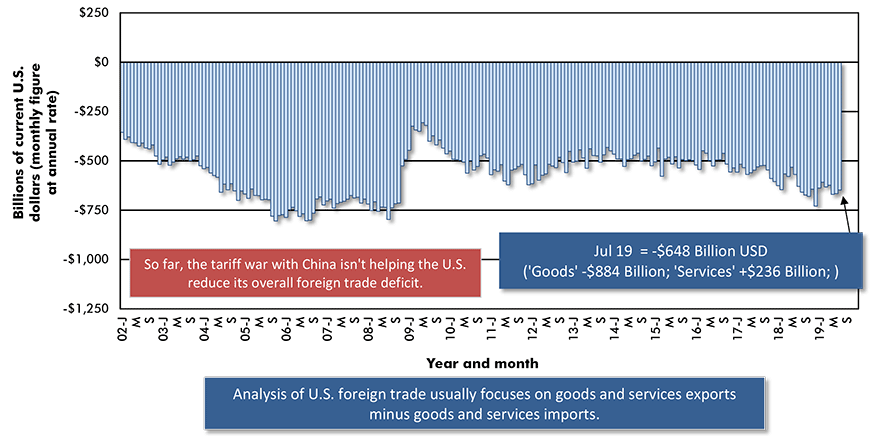
Based on seasonally adjusted monthly figures, projected at an annual rate.
(6) U.S. Shift from Energy Dependency to Energy Powerhouse*
There’s lots of complaining about the state of world oil markets, due to an apparent glut of supply. A sharp increase in U.S. shale-source production has been almost unrestrained, abetted by super-low interest rates and unfettered access to bank loans.
Most recently, there has been a reduction in rig counts to moderate the supply surplus. But acknowledgement of an important structural shift in the make-up of the U.S. economy needs to be made. Many states and regions have either newly become energy-production dependent or have had their previous dependency enhanced.
The impact extends further into industrial sectors, ‒ for example pipe and sand suppliers for fracking operations. And in our own industry, the first section of this Nuggets report lays out how significant energy mega projects have been for construction starts this year and extending back a couple of years.
*Conflict in the Middle East can still have a great impact on the world price of oil. Drone attacks set on fire two major oil fields in Saudi Arabia, causing a shutdown of half that nation’s output as a precautionary measure. Consequently, the price of crude shot up by nearly 20%.
(7) Not Much Let-up in Canadian Housing Starts
Three key influences are supposed to be weighing on Canadian homebuilding activity: (1) concerns about high residential property prices; (2) purchase anxiety from escalating consumer indebtedness; and (3) deliberate government policy alterations (e.g., tightening of criteria for mortgage approvals) to curb housing demand.
What’s the bottom line? Are Canadian housing starts in full-blown retreat?
Nope. They’ve hardly been shaken at all.
Average monthly housing starts through August of last year were 216,000 units (annualized). For the first eight months of this current year, they’ve been 210,000 units. The drop has been barely noticeable, at -2.5%.
Among Canada’s most populous cities (i.e., the six with more than a million citizens each), there have been more dramatic ‘starts’ changes. Year to date, Montreal is leading in total starts, +21%, followed by Vancouver, +20%, and Ottawa-Gatineau, +10%. In Edmonton, there’s been no change, while Toronto and Calgary have experienced pullbacks of the same order, -20%.
Starts in Canada’s major metro areas are much more likely to be of the multi-family variety than in almost any American city. In multi-family starts year to date, Vancouver is the frontrunner, +29%, with Montreal second, +24%. Toronto, which has long been famous for the number of its condo construction cranes, has been quieter this year, -16%.
Alex Carrick is Chief Economist for ConstructConnect. He has delivered presentations throughout North America on the U.S., Canadian and world construction outlooks. Mr. Carrick has been with the company since 1985. Links to his numerous articles are featured on Twitter @ConstructConnx, which has 50,000 followers.
CanaData 2019 Conference – Canada’s construction forecasts conference – October 18, 2019, Globe & Mail Centre, Toronto – Learn more below.


Recent Comments
comments for this post are closed