
Real-time Events are ‘Lapping’ the Measurements
Is there a point to looking at the latest published numbers on the economy, since they date from before activity levels across a broad spectrum of events were so drastically curtailed in mid-March, due to the exponential advance of the new coronavirus in Europe and North America?

The answer is both yes and no. It’s ‘yes’ because crises, in all shapes and sizes, may come and go, but there will always be statistics. They’ll be a part of our history, come what may, and future analysts will delight in making before and after comparisons. They’ll know how swiftly affairs can deteriorate with the onset of a pandemic.
But the answer is also a firm ‘no’, because in the immediate present, it can’t be denied that real-time developments have overtaken and metaphorically, at least, ‘lapped’ the measurements. The delay in calculating and publishing the numbers means they are not keeping up with what is truly transpiring.
No More Open Houses or Model Home Visitations
A key corner of the economy is housing starts. Since the 2008-2009 recession in the U.S., they’ve been gradually picking up, but they have struggled to regain their former vitality.
They fell by -80% from ‘monthly annualized’ peak (2.3 million units in early 2006) to ‘monthly annualized’ trough (500,000 units in mid-2009) in the last downturn. Therefore, their recovery during the past decade has been from an extremely low base.
The blue text box in Graph 1 shows that the annual level of housing starts in the U.S. has recorded nothing but positive percentage changes for years.
Only in the last three months, though, has the monthly annualized level of U.S. housing starts finally reached where it should be, around 1.6 million units seasonally adjusted and annualized (SAAR), in order to accommodate long-term population growth and family formations.
Unfortunately, at this precise moment, when housing starts have finally become robust once again and are positioned to help an economy perhaps grown weary from a long-in-the tooth expansion, the coronavirus has rained down.
Mindful of health directives that everyone should keep their distance, to limit the spread of COVID-19, realtors are recommending that there be no more open houses or model home visitations for a while.
Graph 1: U.S. Monthly Housing Starts
Seasonally Adjusted at Annual Rates (SAAR)
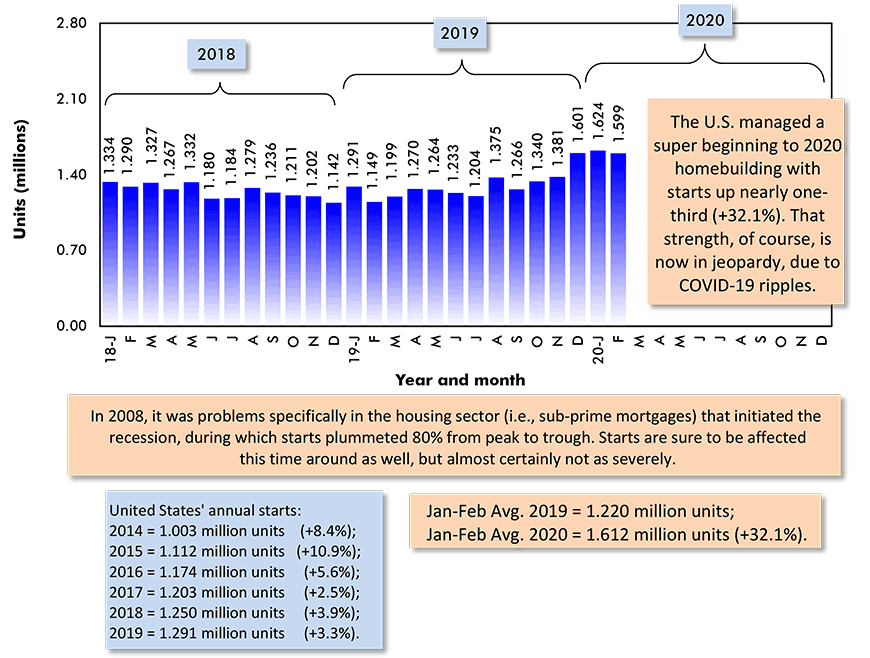
Data source: U.S. Census Bureau (Department of Commerce).
Chart: ConstructConnect.
Construction to Maintain Vital Infrastructure is ‘Essential’
Recent increases in U.S. housing starts have been broadly based, both by type of structure and by region.
On a year-to-date basis, U.S. national home starts in February 2020 were +32.1% compared with January-February 2019 (Graph 2). Multiple-unit starts were +68.0%. But multis comprise only about one-third (35.6%) of the total versus a two-thirds’ share (64.4%) for singles.
A significant year-to-date increase for single-family starts (+18.1%) doesn’t deserve to be eclipsed just because multiples did so well.
Regionally in February 2020, there were outstanding gains everywhere: West, +52.8% ytd; Northeast, +46.4%; Midwest, +30.0%; and South, +21.9%.
In the 2008-2009 recession, the root cause of the economy-wide downturn resided in the housing sector. Specifically, there was a domino tumbling of faulty CDOs (collateralized debt obligations) made up of sub-prime mortgages that should never have been approved.
In this present period of decline, a housing starts setback will be the result of other deteriorating factors, especially business closures and job losses throughout the economy.
‘Shelter-at-home’ proclamations are being adopted or recommended in many states. These encourage working from home and only going out to a job site if the service one provides is ‘essential’.
The biggest firms and major trade associations in the construction sector are striving to have what they offer, especially when tied to maintaining vital infrastructure, judged to be ‘essential’.
Graph 2: U.S. Housing Starts
Jan-Feb 2020 vs Jan-Feb 2019 % Changes
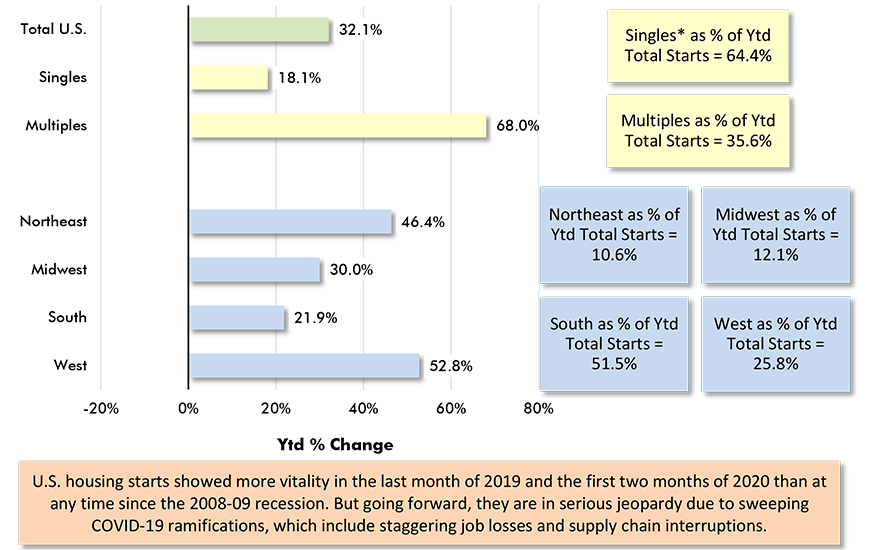
Based on averages of monthly seasonally adjusted and annualized (SAAR) unit starts.
* ‘Singles’ includes townhouse complexes, except when multiple units have common heating & air conditioning.
Data source: U.S. Census Bureau.
Chart: ConstructConnect.
Mortgage Relief, U.S. and Canada
In the U.S., the headlines have been shouting that secondary mortgage backers HUD, Fannie Mae and Freddie Mac, to help homeowners through tough time, ‒ and provide financial relief for ‘family-heads’ who may be newly out of work ‒ are instructing ‘servicers’ (i.e., commercial banks) to suspend foreclosures and evictions.
It’s in the bodies of such announcements, however, where relevant timing detail is to be found. The duration of forgiveness appears to vary. HUD’s suspension period goes to the end of April, which is not far away. Fannie Mae and Freddie Mac are easing their repayment provisions for at least 60 days.
There is also talk of homeowners being able to invoke ‘hardship forbearance’ for a year. ‘Hardship forbearance’ has often been granted previously in regions devasted by natural disasters, such as hurricanes or tornadoes.
Left out of these mortgage relief efforts, however, are renters who may suddenly be unable to meet their monthly obligations. Hence, the calls for government assistance that will go directly to individuals through expanded unemployment insurance coverage, or even public payouts of $1,200 ‘rescue’ checks.
In Canada, the six major banks (i.e., the biggest mortgage providers) have jointly announced a mortgage-payment pause, if needed, and to be negotiated on a case-by-case basis, for six months.
The point is emphasized that such a measure, if enacted, will be a deferral. There’ll be no amnesty.
Canadian Home Starts ‒ No Immigration & Extra Mortgage Risk
Canadian housing starts in the 2008-2009 recession dropped by about one-half, but they quickly bounced back. They’ve fluctuated in a narrow band around 200,000 units annually for the past ten years. In January and February of 2020, they were 214,000 and 210 units (SAAR) respectively.
A soon-to-happen jog upwards from the 200,000-unit norm seemed inevitable, given the enormous increases to Canada’s population that have been occurring in the last couple of years. In 2019, the jump in residents was half a million individuals.
In 2020, though, that +500,000-pace of population increase will not be sustained. Four-fifths of the half-million increase last year came from immigrant arrivals. To fend off COVID-19’s incursion, borders everywhere have now been closed. Flights in and out of Canada are being curtailed.
The Bank of Canada, like the U.S. Fed, has swiftly lowered its policy-setting interest rate. The ‘overnight rate’ is currently 0.75%, with the prospect that it may go lower, to match the Fed’s move near to zero percent.
But mortgage rates are proving sticky. Where theory would say they should drop in keeping with the overnight rate’s decline, there’s the not so small matter of increased risk to consider. The mortgage lending community is cognizant that the current medical-care and economic crises, accompanied by considerable job losses, make lending a more precarious business.
Graph 3: Canada Monthly Housing Starts
Seasonally Adjusted at Annual Rates (SAAR)
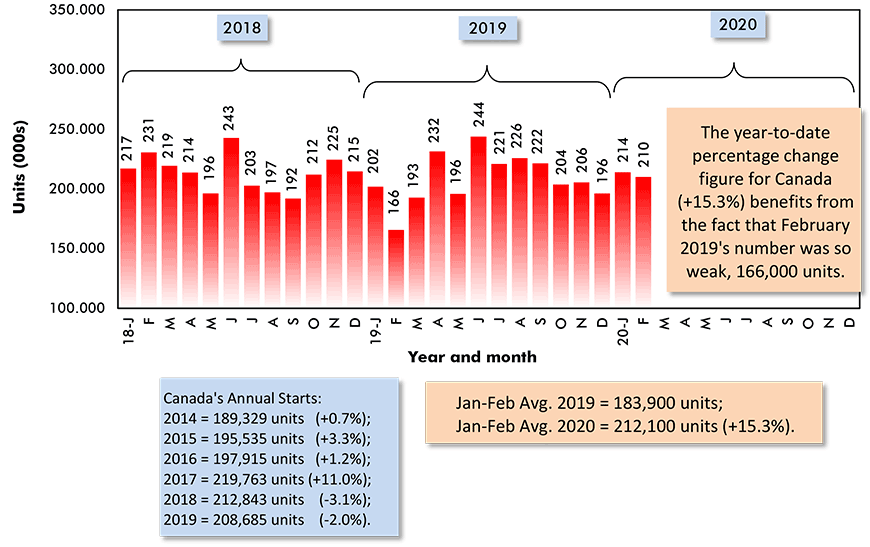
Data source: Canada Mortgage and Housing Corporation (CMHC).
Chart: ConstructConnect.
Graph 4: Per cent Change In Year-To-Date Housing Starts –
Ranking Of Canada’s Major Cities
(Jan-Feb 2020 vs Jan-Feb 2019)
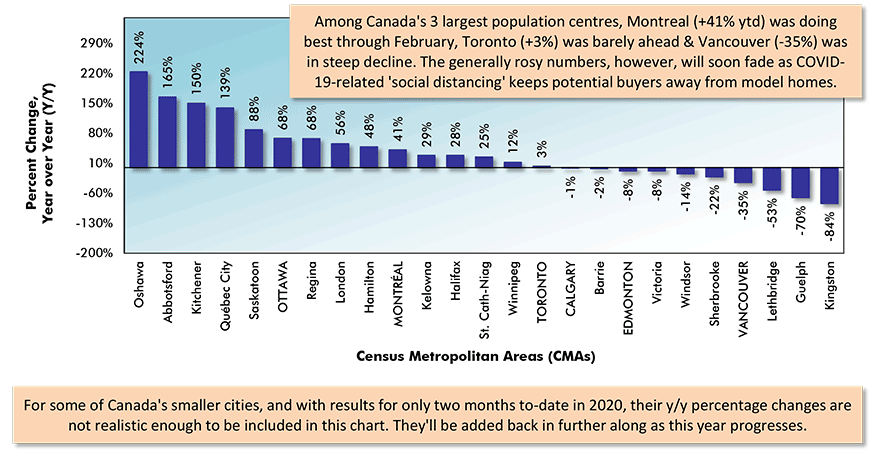
Canada’s Census Metropolitan Areas (CMAs) have core populations of 50,000 plus.
Canada’s 6 CMAs with populations in excess of 1 million are in capital letters.
Data source: Canada Mortgage & Housing Corporation (CMHC) based on actuals rather than seasonally adjusted data.
Chart: ConstructConnect.
Alex Carrick is Chief Economist for ConstructConnect. He has delivered presentations throughout North America on the U.S., Canadian and world construction outlooks. Mr. Carrick has been with the company since 1985. Links to his numerous articles are featured on Twitter @ConstructConnx, which has 50,000 followers.


Recent Comments
comments for this post are closed