A Faint Echo of Normalcy in Hospitality Sales?
In the U.S., retail and food services sales are combined in a single monthly report from the Census Bureau. Also, the data is relatively current. Latest results are for June 2020.

In Canada, ‘retail sales’ appear in one report, but one must chase down ‘food services and drinking place’ sales from another location. Also, the Canadian information is somewhat ‘stale’. For example, the latest Canadian data is for May 2020. Nevertheless, it’s what’s available.
Year-over-year ‘restaurant and bar’ sales for Canada and the provinces are set out in the interactive graph appearing below. By now, it’s well-known that the biggest job losses in the economy resulting from the coronavirus contagion and ‘remedial’ distancing have occurred in the hospitality sector. Graph 1 offers further confirmation.
As recently as February, nation-wide ‘food services and drinking place’ sales were upbeat, +3.4% year over year. In March, though, circumstances altered significantly. The total Canada figure became -36.2% y/y. Furthermore, all provinces were affected to nearly the same degree. The year-over-year percentage declines were in a narrow range, moving from -30.4% y/y for Nova Scotia to -38.4% for Quebec.
In April, a bad situation became much worse. The total Canada figure fell to -62.9% y/y and there was more separation in the provincial numbers. Small-population, but tourism-dependent, Prince Edward Island recorded a decline of ‘just’ -50.0%. At the other extreme, Quebec’s drop was -70.0%.
Thankfully, the month of May signaled the beginning of a turnaround. The Canada-wide figure ‘improved’ (a cavalier use of the word) to -49.8% y/y, with New Brunswick at the low end, -33.2%, and Quebec still at the high, -56.4%. Ontario, -52.7%, wasn’t much better than Quebec.
The process of re-opening the Canadian economy has been speeding up of late. For example, almost all of Ontario has entered Phase 3, with only the Windsor region remaining in Phase 2.
As Graph 1 illustrates, however, there is still a long way to go before even a faint echo of normalcy concerning ‘a night out on the town’ will be achieved.
Interactive Visual: Graph 1
Toronto Records Horrendous Retail Sales in May
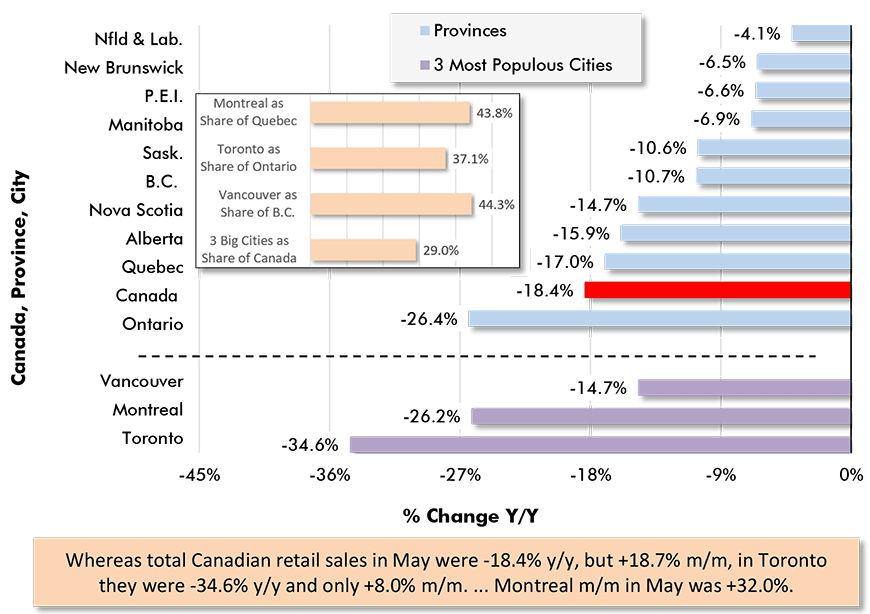
Graph 2 moves the discussion to Canadian retail sales.
Total Canadian retail sales in May were -18.4% y/y. U.S. total retail sales, after being steeply negative in May, returned to about level on a year-over-year basis in June. Hopefully, the Canadian experience will be similar.
As for May, Ontario among all provinces had the worst performance, -26.4% y/y. Toronto’s retail sales were especially abysmal, -34.6% y/y (i.e., down by more than one-third).
Toronto houses 17% of the nation’s population. In May, the city’s share of total Canada retail sales was a relatively meager 13%.
Compared with Toronto (-34.6% y/y) and Montreal (-26.2% y/y), Vancouver’s retail sales decline in May, at -14.7%, was barely noteworthy.
Graph 2: Retail Sales ‒ Canada, Provinces & Cities
May 2020 Year Over Year (Y/Y) & Shares

Retail Sales by Shopkeeper Categories – Furniture Worst
Canadian motor vehicle and parts sales in May were -39.3% y/y. While that may sound bad, consider that in April they had been -63.2% y/y. On a month-to-month basis in May, auto-related retail sales were +66.3%.
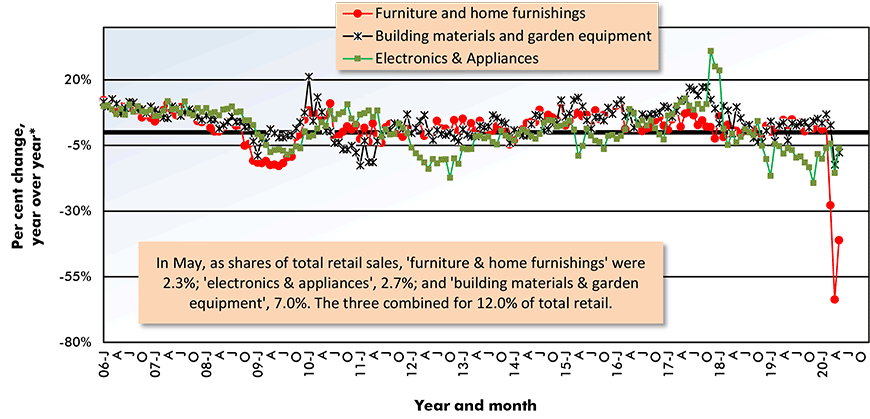
As for other categories of shopkeeper sales, Graph 3 highlights three with close ties to everyone’s accommodations.
‘Electronic and appliance’ store sales may have been -6.1% y/y in May, but they were +12.1% m/m.
‘Building and garden equipment’ store sales were -7.6% y/y, but +5.5% m/m.
And finally, ‘furniture and home furnishing’ sales were dismal at -41.1% y/y in May, but they were chipper m/m at +58.6%. After all, in April, they had been -63.7% y/y.
Graph 3: Canadian Home-Related Retail Sales

*”Year over year” is each month versus the same month of the previous year.
Based on ‘current’ (i.e., no accouting for inflation) dollar and seasonally adjusted data.
Alex Carrick is Chief Economist for ConstructConnect. He has delivered presentations throughout North America on the U.S., Canadian and world construction outlooks. Mr. Carrick has been with the company since 1985. Links to his numerous articles are featured on Twitter @ConstructConnx, which has 50,000 followers.


Recent Comments