
The Fun of ‘Home’ Shopping on the Internet
In the early days of the coronavirus health crisis, an expectation was held by many analysts in the U.S. and Canada that residential real estate would be devastated. After all, there were enormous jobs and income losses in March and April and with ‘social distancing’ becoming the rule, there was no taste for ‘open houses’ or walk-through visitations.

Then a surprising thing happened. High-tech rode to the rescue. Just as video conferencing has saved many businesses in this difficult year, going on-line to view new model and existing homes ‘virtually’ has provided a necessary lifeline for realtors. Also, sellers and buyers have readily adapted to a new world in which bid negotiations and contract signings are being conducted digitally.
Furthermore, house shopping on the Internet is faster. There’s no driving to preferred neighborhoods to ring doorbells and look for cracks in the plaster.
And it can be fun, like a video game. Again, technology advances have made this possible. 3D and 360⁰ cameras capture easy visualizations. Interior and exterior, plus daytime and nighttime, shots fully round out potential purchasers’ viewing experiences. The ‘coolest’ real estate adventure is to see a home offered for sale laid out on a monitor with all its structural features exposed in what’s known as a ‘doll house’ effect.
Better Affordability from Low Mortgage Rates Undercut by Rapid Price Advances
Beginning in early summer, the demand for new and existing housing has been proceeding at a torrid pace. Some of the factors contributing to the feverish activity have been: (1) an accumulation of pent-up demand that has developed over the past decade; (2) an increase in the savings rate that facilitates a faster build-up of a new home down payment; (3) a mobility shift away from dense and, at least as perceived in the moment, less-healthy city cores in favor of the suburbs and rural communities; and (4) all-time low mortgage rates.
Greater mobility as an option has been promoted by the newly widespread practice of working from home. It has also been boosted by a desire on the part of many individuals and families to escape the harmful effects of climate change. Wildfires and hurricanes, plus affordability issues (e.g., rising house prices and cost of insurance), are initiating an exodus from coastal regions to the interior.
The location shifts have been a boon to single-family housing over the multi-family segment of residential real estate. Also, bigger accommodations with more square footage help with the establishment of home office space.
Plus, interesting changes are underway in areas usually reserved for vacation properties. What were secondary residences are becoming primary residences. The appetite for such possibilities is heating up accordingly.
The positive effect on housing demand of bargain interest rates is being somewhat subverted, however, by a surge in prices that is underway. The remainder of this article, mainly through graphs, will delve into the statistics on homebuilding in the U.S. and Canada and how new and existing home prices are reacting.
U.S. New & Existing Homes Marketplace and Prices
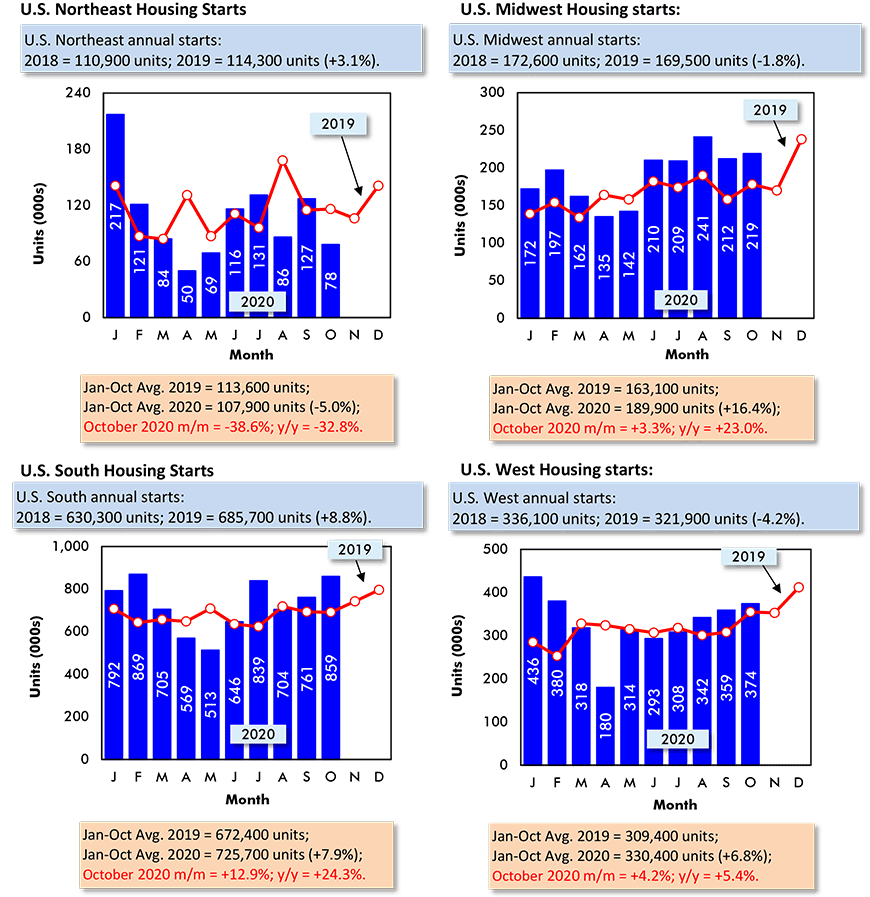
In late-2019-early-2020, monthly U.S. housing starts (seasonally adjusted and annualized/SAAR) finally returned to the level generally assumed to be consistent with the need generated by population growth and family formations, around 1.6 million units. Then the pandemic struck, depressing starts below 1.0 million units.
Over the latest four months, though, starts have been much better again, climbing above 1.5 million units in October. The 1.6 million-units figure is a handy benchmark, but it’s significance may be overblown. The long-term average of U.S. monthly housing starts, dating back to 2000, has been 1.25 million units SAAR. On that basis, and given that America’s population growth has slowed dramatically, October’s 1.5 million is looking pretty good.
According to the latest press release from the National Association of Realtors (NAR), U.S. single-family ‘existing’ (i.e., as opposed to ‘new’) home sales in September were +21.8% year over year. The median price for single-family homes sold in September was +15.2% y/y.
Unit sales of condos and co-ops in the latest month in the NAR’s stats were +13.6% y/y, with a median price climb of +9.9% y/y.
The median price for single-family homes sold in September was $316,000; for condos and co-ops, $273,000.
Resale house price increases coming from the S&P CoreLogic Case-Shiller resale housing price indices have also been bullish, although not to quite the same degree as the NAR’s figures.
Case-Shiller’s National Home Price Index in August was +5.7% year over year. The 10 large-city composite index was +4.7% y/y and the 20-city composite index, +5.2%.
The big-population centers with the largest resale housing price bumps, as calculated by Care-Shiller, have been Phoenix, +9.9% y/y; Seattle, +8.5%; and San Diego, +7.6%.
According to the U.S. National Association of Home Builders (NAHB), sales of freshly built single-family homes in September were +32% year over year. Regionally, the percentage changes were: Northeast, +22.5%; Midwest, +25.9%; South, +14.4%; and West, +18.0%.
A supply problem is putting pressure from below on prices. The number of months’ inventory of both new and existing homes available for sale has shrunk to long-term lows of 4.0 or less (from what’s usually around 6.0).
Graph 1: U.S. Monthly Housing Starts
Seasonally Adjusted at Annual Rates (SAAR)
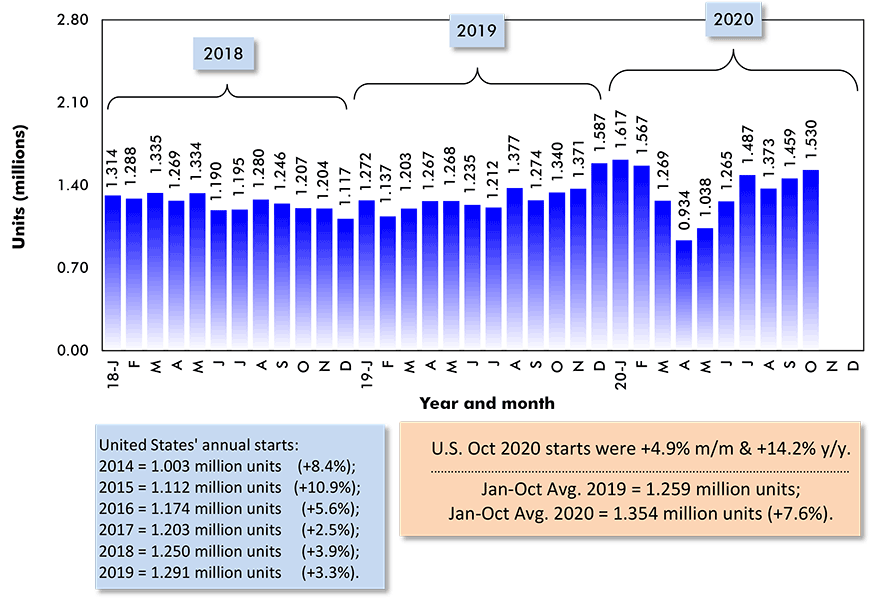
Data source: U.S. Census Bureau (Department of Commerce).
Chart: ConstructConnect.
Graph 2: U.S. Single-Family & Multi-Family Monthly Housing Starts
Seasonally Adjusted at Annual Rates (SAAR)
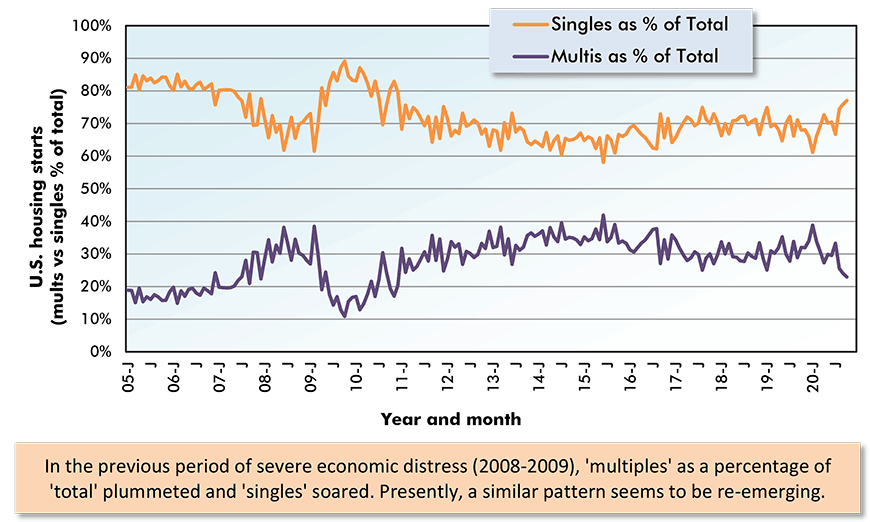
The last data points are for October 2020.
Data source: U.S. Census Bureau (Department of Commerce).
Chart: ConstructConnect.
Graph 3: U.S. Total Monthly Housing Starts
Seasonally Adjusted at Annual Rates (SAAR)
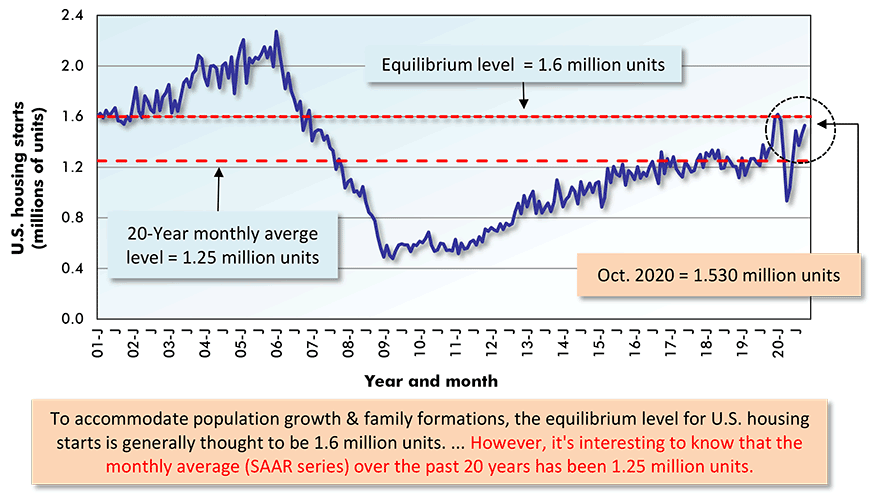
The last data points are for October 2020.
Data source: U.S. Census Bureau (Department of Commerce).
Chart: ConstructConnect.
Graph 4: U.S. Monthly Residential Building Permits
Seasonally Adjusted at Annual Rates (SAAR)
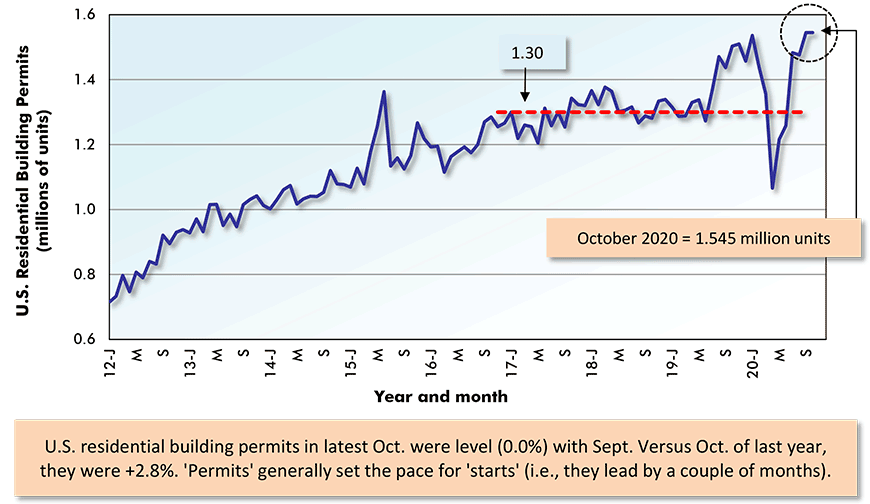
The last data point is for October 2020.
Data source: U.S. Census Bureau (Department of Commerce).
Chart: ConstructConnect.
Graph 5: U.S. Housing Starts
Jan-Oct 2020 vs Jan-Oct 2019 % Changes
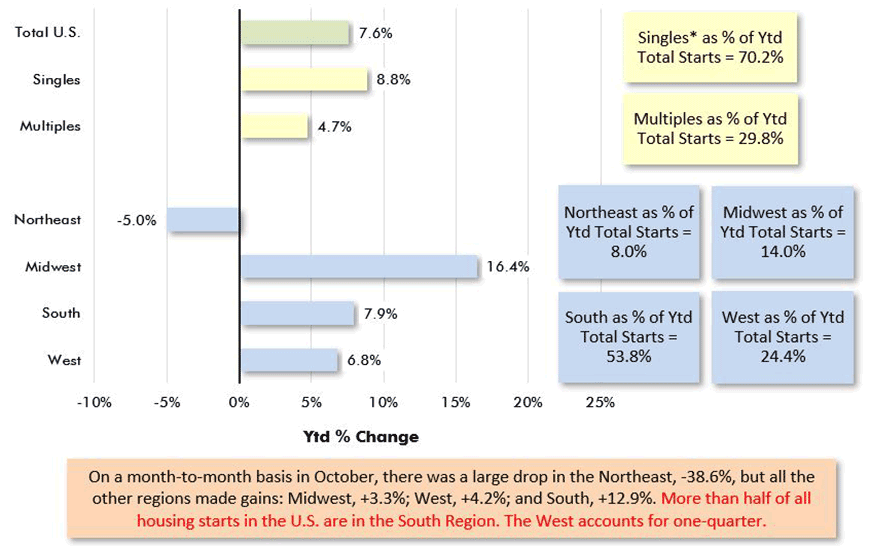
Based on averages of monthly seasonally adjusted and annualized (SAAR) unit starts.
* ‘Singles’ includes townhouse complexes, except when multiple units have common heating & air conditioning.
Data source: U.S. Census Bureau.
Chart: ConstructConnect.
Graph 6: U.S. Regional Housing Starts
Data source: U.S. Census Bureau (Department of Commerce).
Chart: ConstructConnect.
Graph 7: U.S. and Canada Monthly Housing Starts
Seasonally Adjusted at Annual Rates (SAAR)
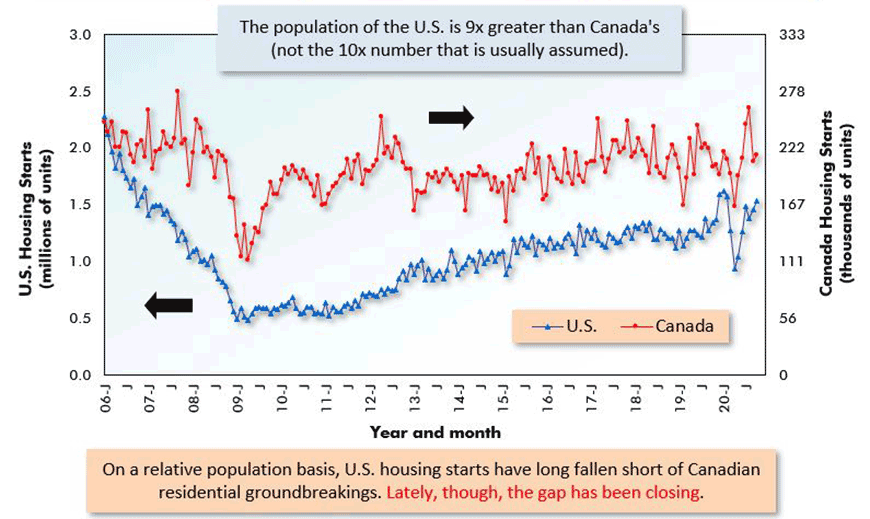
The last data points are for October 2020.
ARROWS: U.S. numbers to be read from left axis; Canadian from right axis.
Data sources: U.S. Census Bureau & Canada Mortgage and Housing Corp (CMHC).
Chart: ConstructConnect.
The Canadian Residential Real Estate Scene
Monthly average housing starts in Canada through October of this year at 212,700 units (SAAR) are little changed (+1.1%) from the 210,300-unit level realized in the first ten months of last year.
It’s no shock when monthly annualized Canadian housing starts are close to 200,000 units. The monthly average over the past 20 years has been 200,000; the monthly average over the past 10 years has likewise been 200,000.
It seems that 200,000 is the ‘norm’ come what may. Even the pandemic hasn’t stood in the way of that figure being realized.
Earlier in 2020, it seemed logical to expect the big drop in Canadian immigration this year, due border closings as a measure to block the arrival of COVID-19-infected foreign individuals, would cause a pause in the building of new lodgings.
Indeed, listings of condo units available for rent in some major centers have been soaring (i.e., indicative of an ‘emptying out’), but whatever slack may be appearing in multi-unit occupation is being taken up on the single-family side.
Also interesting to file for future reference is the federal Liberal government’s stated intention to recoup this year’s shortfall in immigration over the next couple of years. The previous goal of 300,000 immigrant arrivals per annum may be raised to 350,000 or more.
The epicenter of Canadian home starts strength this year is Toronto (+43% year to date in singles; +22% ytd in multiples; and +24% in ‘total’). Vancouver, which usually gives Toronto a ‘run for its money’, has faltered badly (-13% ytd in singles; -28% in multiples; and -26% in ‘total’).
There is one other city, though, that has done notably well. The Ontario portion of the nation’s capital, Ottawa-Gatineau, has managed outstanding year-to-date pickups in multi-unit and total-unit starts, +38% and +29% respectively.
The buoyancy of Ottawa’s housing market is also made clear in the ‘price map’ appearing at the Internet site of the Canadian Real Estate Association (CREA). The price jump for Ottawa-Gatineau resale homes is currently greater than +20%.
The existing-homes price bounces, year over year, for other major Canadian urban centers in October, as appearing in CREA’s price map, were +15.7% in Montreal; +10.8% in Toronto; and +6.0%, Vancouver.
Edmonton, at +1.5% y/y, and Calgary, +0.3%, have seen minimal resale home price movement. A weak energy sector has compounded Alberta’s coronavirus-related economic woes.
The nation-wide figure showcased in CREA’s price map for October is +15.2% y/y.
Finally, there’s Statistics Canada’s New Housing Price Index (NHPI) for insight into the current cost of residential construction. The NHPI for Canada in October was +3.9% year over year, with ‘structure only’ at +4.5% and ‘land only’ at +3.1%.
The new housing cost increases for major cities in the latest reporting month for the NHPI (October) were Montreal, +8.7%; Ottawa-Gatineau, Ontario portion, +13.0%; Ottawa-Gatineau, Quebec portion, +3.7%; Toronto, +2.3%; Calgary and Edmonton, each 0.0%; and Vancouver, +5.7%.
Graph 8: Canada Monthly Housing Starts
Seasonally Adjusted at Annual Rates (SAAR)
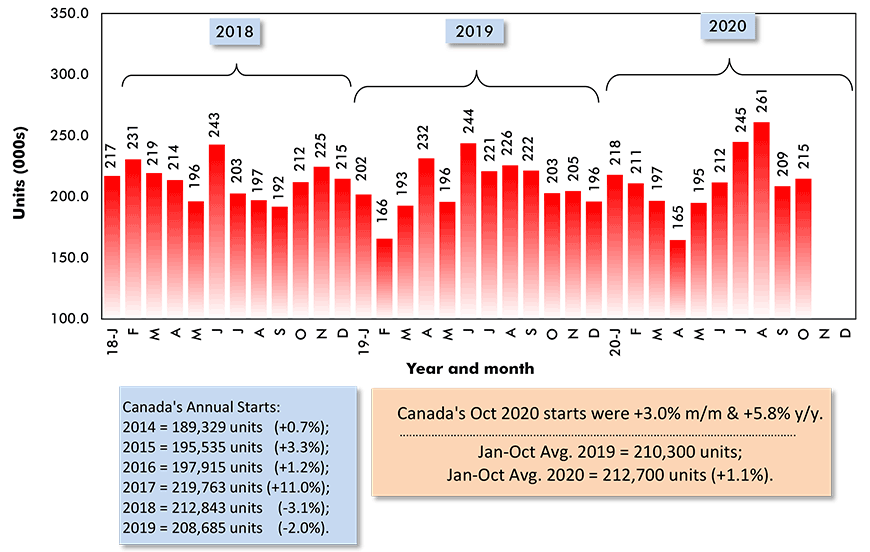
Data source: Canada Mortgage and Housing Corporation (CMHC).
Chart: ConstructConnect.
Graph 9: Percent Change in Year-To-Date Housing Starts –
Ranking Of Canada’s Provinces
(Jan-Oct 2020 vs Jan-Oct 2019)
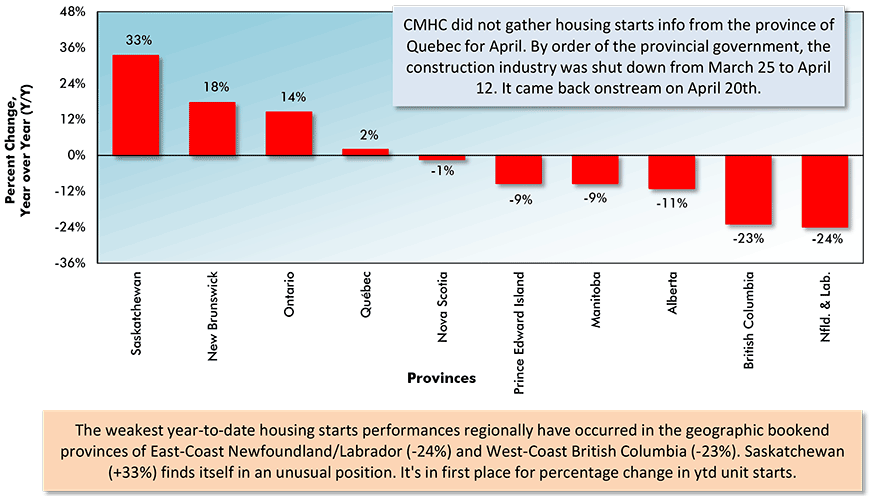
Data source: Canada Mortgage & Housing Corporation (CMHC) based on actuals rather than seasonally adjusted data.
Chart: ConstructConnect.
Graph 10: Percent Change in Year-To-Date Housing Starts –
Ranking Of Canada’s Major Cities
(Jan-Oct 2020 vs Jan-Oct 2019)
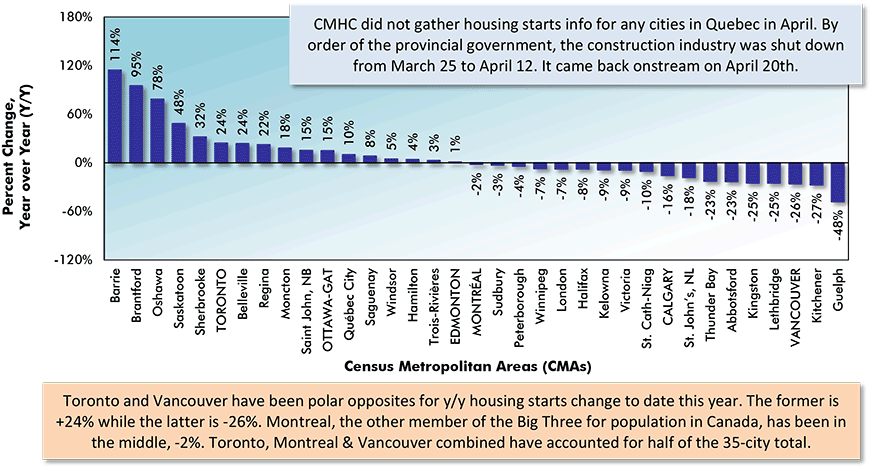
Canada’s Census Metropolitan Areas (CMAs) have core populations of 50,000 plus.
Canada’s 6 CMAs with populations in excess of 1 million are in capital letters.
Data source: Canada Mortgage & Housing Corporation (CMHC) based on actuals rather than seasonally adjusted data.
Chart: ConstructConnect.
Graph 11: Housing Starts in Canada’s 6 Most Populous Cities
January to October Ytd Actuals
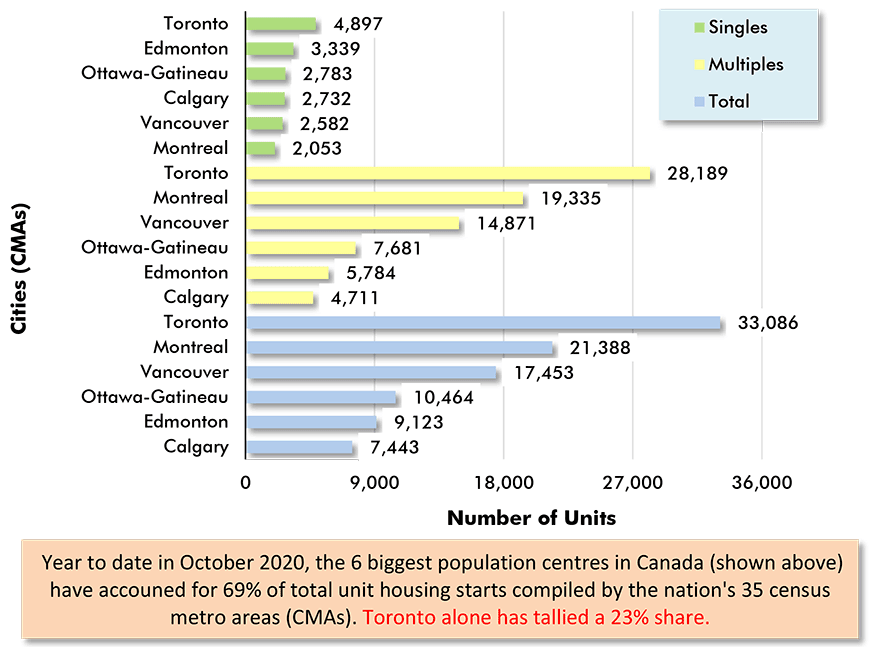
Data source: Canada Mortgage & Housing Corporation (CMHC).
Chart: ConstructConnect.
Graph 12: Housing Starts in Canada’s 6 Most Populous Cities
Jan-Oct 2020 vs Jan-Oct 2019
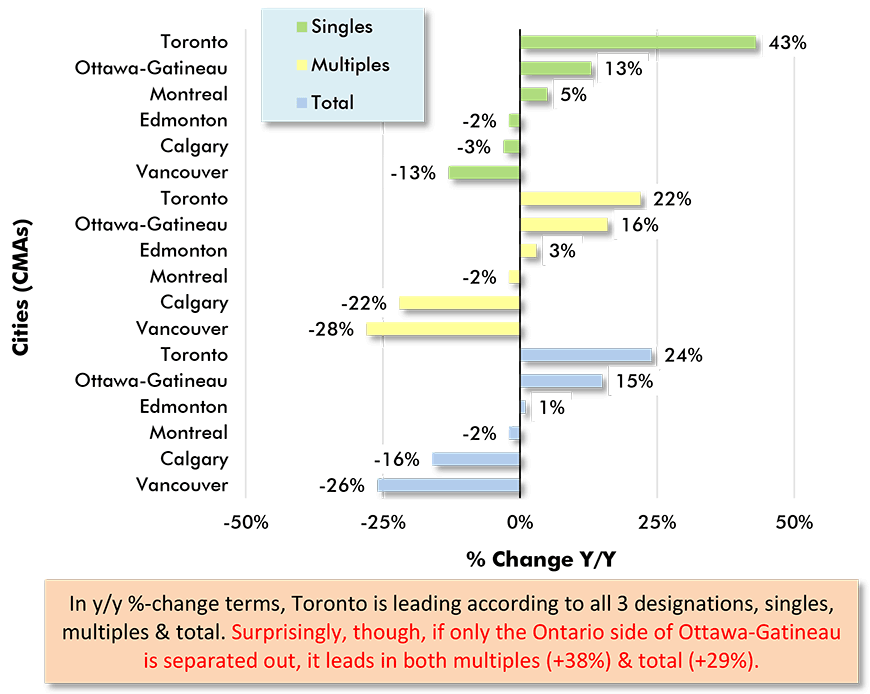
Data source: Canada Mortgage & Housing Corporation (CMHC).
Chart: ConstructConnect.
Alex Carrick is Chief Economist for ConstructConnect. He has delivered presentations throughout North America on the U.S., Canadian and world construction outlooks. Mr. Carrick has been with the company since 1985. Links to his numerous articles are featured on Twitter @ConstructConnx, which has 50,000 followers.


Recent Comments
comments for this post are closed