
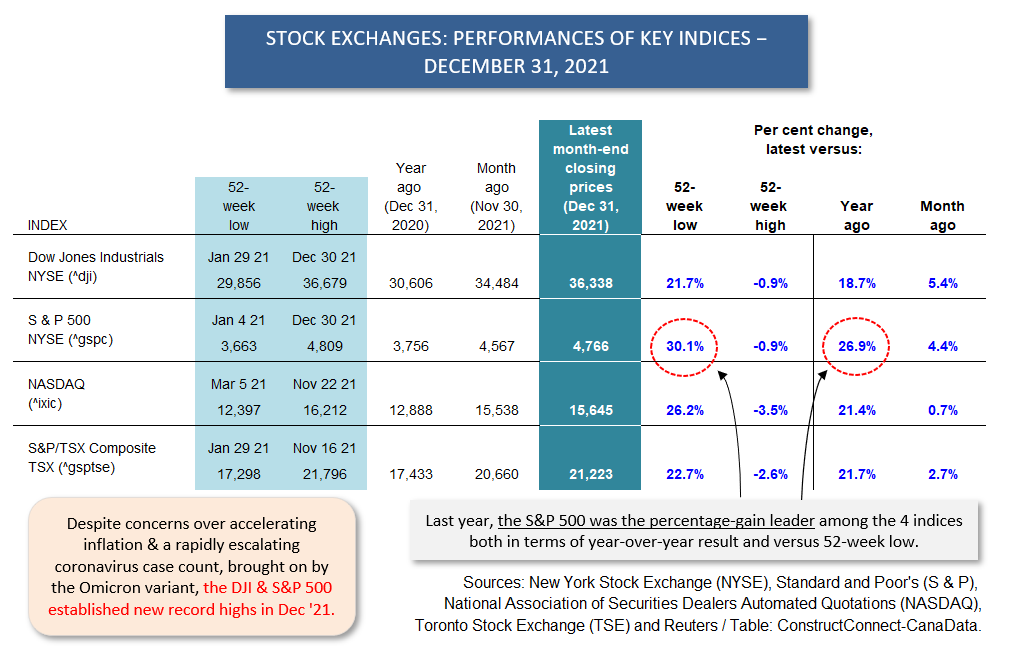
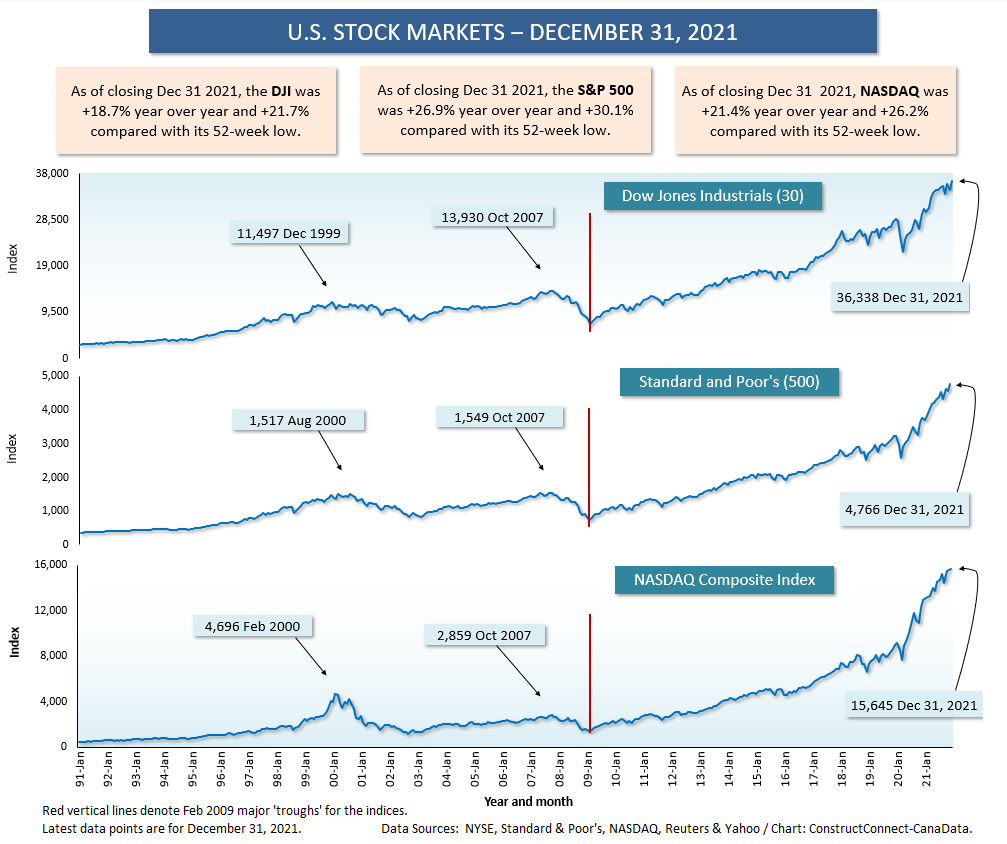
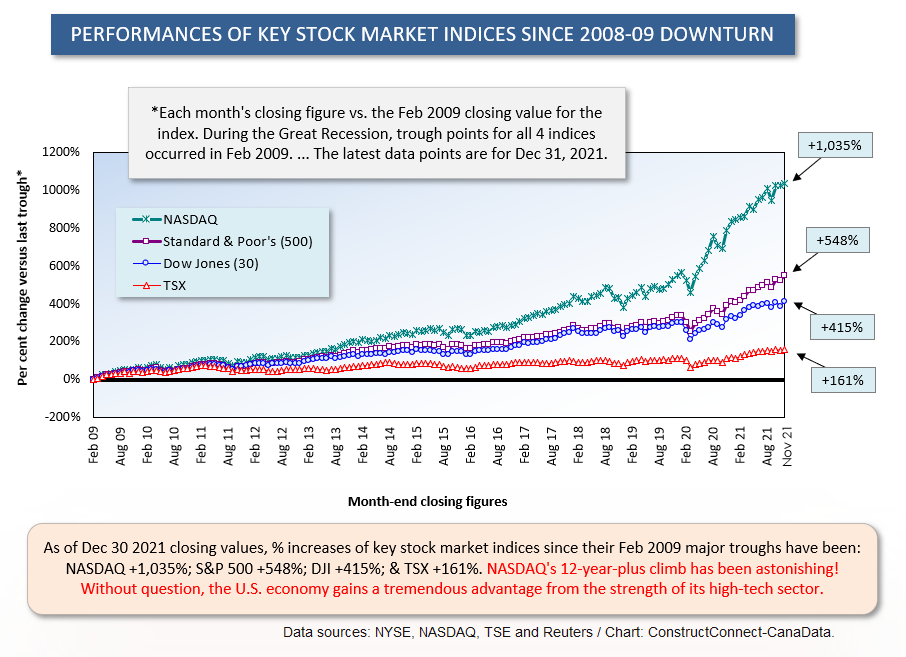
North America’s four major stock market indices experienced another year of outstanding success in 2021. Never mind the pandemic or the fact rampant inflation is causing central banks to consider bringing forward interest rate hikes, the Dow Jones Industrial index and the S&P 500 both established new record highs in December. NASDAQ and the Toronto Stock Exchange ended the year down only a little from the all-time peaks they set a month earlier in November.
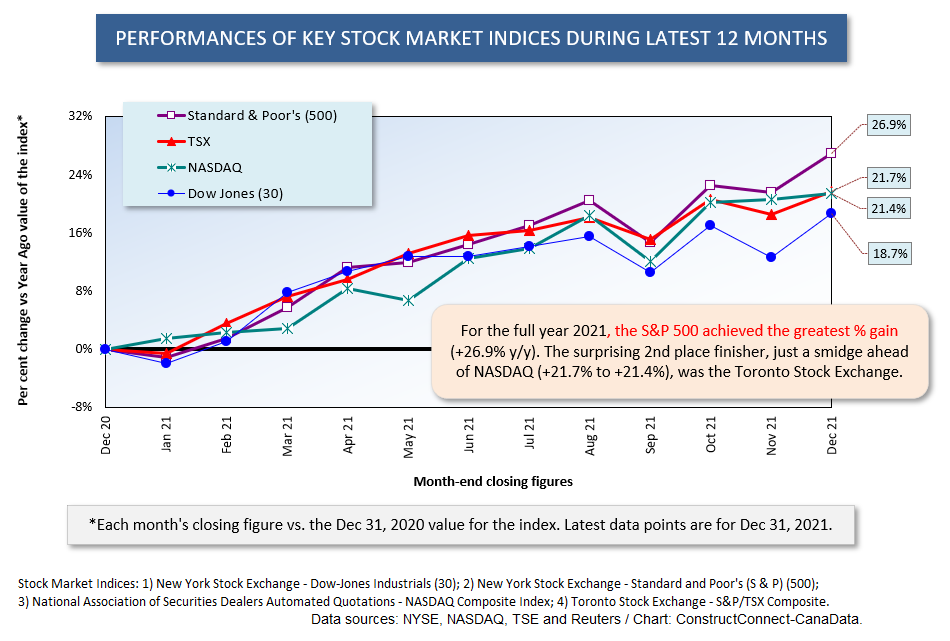
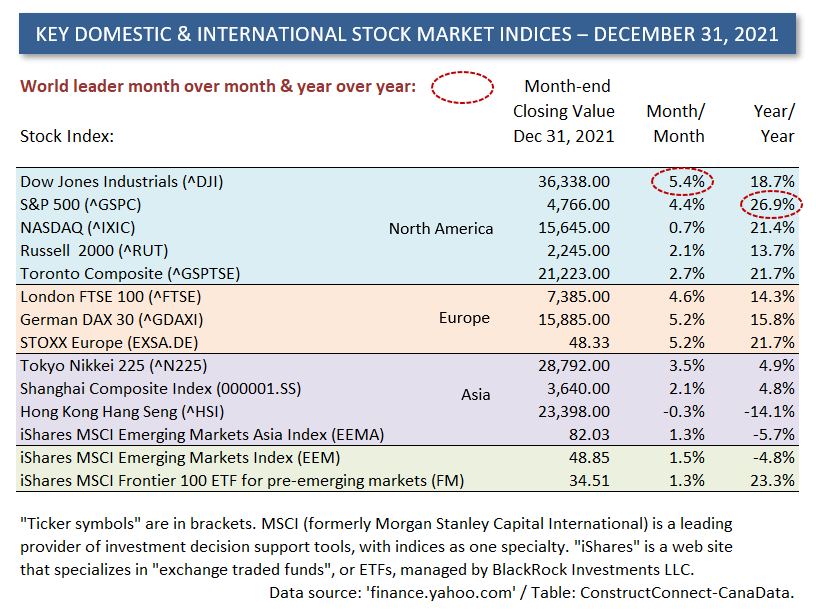
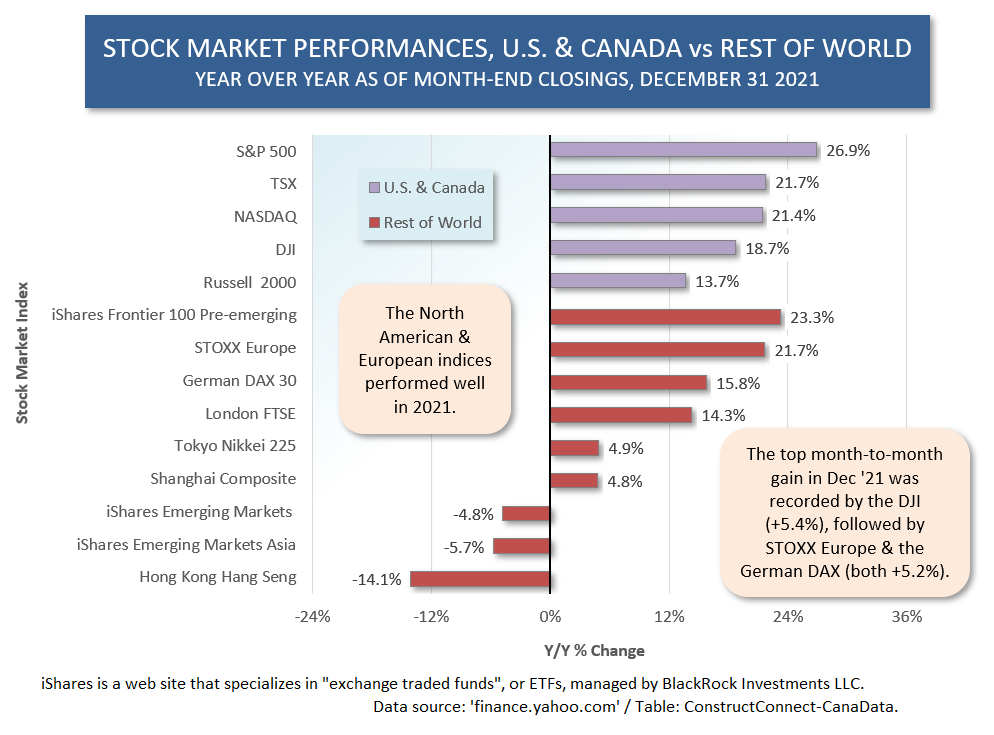
 One difference from 2020 was that in 2021, it wasn’t NASDAQ that was the trend setter. Instead, the S&P 500 achieved the largest annual gain, +26.9%. Nor was NASDAQ even in second place. That honour went to the TSX, +21.7%, although only by the slimmest of margins since NASDAQ in third spot was +21.4% year over year. The DJI, despite managing a solid gain of +18.7%, was relegated to fourth position. (The Russell 2000 index, with a y/y increase of +13.7%, would have placed fifth, or last, if it had been included in Table 1.)
S&P Dow Jones Indices, a division of S&P Global, calculates sub-indices based on sectors for both the S&P 500 and the S&P/TSX; in other words for the U.S. and Canada stock markets.
In both nations, the three leading sectors for corporate equity appreciations throughout full year 2021 were:
- ‘energy’ (+54.6% in the U.S. and +48.9% in Canada);
- ‘real estate’ (+46.2% in the U.S. and +37.4% in Canada);
- and ‘financials’ (+35.0% in the U.S. and +36.5% in Canada).
Some other sectors with their related corporate share gains were as follows:
- ‘information technology’, +34.5% in the U.S. and +18.5% in Canada;
- ‘consumer discretionary’, +24.4% in the U.S. and +18.5% in Canada;
- ‘materials’, +27.3% in the U.S. and +4.0% in Canada;
- ‘communication services’, +21.6% in the U.S. and +24.7% in Canada;
- ‘industrials’, +21.1% in the U.S. and +16.5% in Canada;
- ‘consumer staples’, +18.6% in the U.S. and +22.4% in Canada; and
- ‘utilities’, +17.7% in the U.S. and +11.7% in Canada
The above sectoral categorizations are from the Global Industry Classification Standard (GICS) set up for the financial community. A Wikipedia link to the definitions can be accessed by clicking on https://en.wikipedia.org/wiki/Global_Industry_Classification_Standard .
Under the GICS, the ‘materials’ sectoral index includes major publicly-listed firms primarily engaged in supplying construction materials.
The ‘industrials’ sectoral index includes major publicly-listed companies engaged in providing building products, engineering services and construction (GC and specialty trade) work.
Table 1
Graph 1
Graph 2
Graph 3
Graph 4
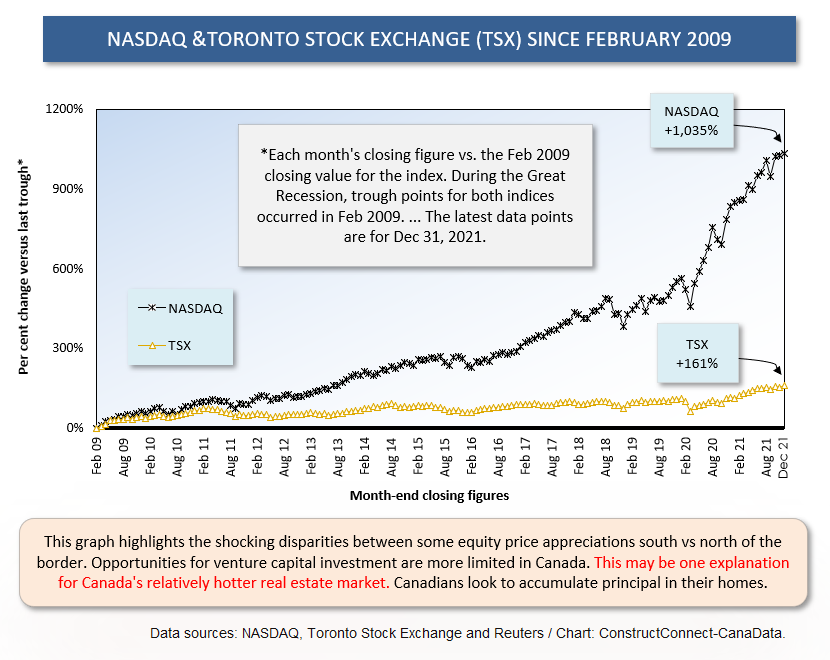
Table 2
Graph 5
Alex Carrick is Chief Economist for ConstructConnect. He has delivered presentations throughout North America on the U.S., Canadian and world construction outlooks. Mr. Carrick has been with the company since 1985. Links to his numerous articles are featured on Twitter @ConstructConnx, which has 50,000 followers.


Recent Comments