Recently, ConstructConnect took a close look at the movement in U.S. construction material costs, through focusing on the Industrial Product Price Indices (PPIs) calculated and published by the Bureau of Labor Statistics.
This current article carries out a similar analysis for Canada. The north-of-the-border data series that are equivalent to the U.S. PPI are the Industrial Product Price Indices (IPPIs) and the Raw Materials Price Indices (RMPI) from Statistics Canada.
The same as for the PPI, the IPPI captures the prices received by producers as their products ‘leave the front gate’. One departure from the PPI, however, is a greater influence arising from currency values. Many Canadian manufactured goods are destined for export and their prices are expressed in U.S. dollars. For those products, their IPPI data points may (i.e., depending on a company’s pricing strategy) be affected when the Canadian-dollar-to-U.S.-dollar exchange rate changes.
Again, tariffs are not supposed to directly affect the IPPI results, but since they do alter the competitive environment, there is evidence of their impacts regardless.
The costs of key raw materials utilized by Canadian manufacturers are monitored by the RMPI. This article will use the words ‘price’ and ‘cost’ interchangeably. The ‘price’ is what producers receive; the ‘cost’ is what purchasers pay. At the bottom of the text below, there is a brief explanation of how price or cost indices are composed and why they are so informative.
Table 1 gathers together many of the IPPI and RMPI data series of most relevance for the construction sector. Appropriate weighted averages of inputs – i.e., there is more lumber used in residential work and more energy products absorbed into engineering projects − reveal that residential material costs rose +4.3% year over year (y/y) in January 2019; non-residential building costs climbed by +2.4%; and the bump-up in civil construction costs was +3.3%.
The ‘composite’ total construction cost increase in the latest month for which data is available (January 2019) was +3.5%. The total construction cost index percentage changes for various time frames, as calculated by ConstructConnect, are lightly shaded in gray.
Raw Materials Price Index (RMPI) Results
% Change in the January 2019 Index from:
| 3 Years | 1 Year | 6 Months | 3 Months | 1 Month | |||
| Ago | Ago | Ago | Ago | Ago | |||
| Type of Construction Indices: | |||||||
| Residential | 8.9% | 4.3% | -1.8% | 0.0% | -0.2% | ||
| Non-residential Building | 6.3% | 2.4% | 0.3% | 0.2% | 0.1% | ||
| Engineering/Civil | 12.7% | 3.3% | -1.9% | -2.3% | -0.1% | ||
| Total Construction | 9.8% | 3.5% | -1.4% | -0.8% | -0.1% | ||
| Key Aggregates: | |||||||
| Lumber and other wood products | 11.6% | 4.7% | -5.4% | 0.5% | -0.3% | ||
| Primary ferrous metal products | 20.6% | 14.5% | 0.3% | 0.5% | -0.3% | ||
| Primary non-ferrous metal products | 9.6% | -4.7% | -2.8% | 2.0% | -0.3% | ||
| Fabricated metal products and construction materials | 14.4% | 8.4% | 1.6% | 2.3% | 0.7% | ||
| Machinery and equipment (includes HVAC) | 3.4% | 3.6% | 1.2% | 0.6% | 0.1% | ||
| Electrical, electronic and telecommunications | -2.3% | 2.8% | 0.5% | 0.7% | -0.4% | ||
| Cement, glass, other non-metallic minerals | 4.9% | 1.3% | -0.1% | -0.4% | 0.3% | ||
| Petroleum and coal products | 26.0% | -8.1% | -14.8% | -15.2% | -1.8% | ||
| Chemicals and chemical products | 2.0% | -1.1% | -0.8% | -4.4% | -1.0% | ||
| Construction Inputs: | |||||||
| Softwood lumber (spruce-pine-fir) | 8.3% | -12.2% | -25.8% | 0.5% | -0.3% | ||
| Veneer and plywood | 12.6% | 0.0% | -8.5% | 4.2% | 1.6% | ||
| Waferboard and particle board | 29.5% | 16.3% | -4.7% | -0.2% | 0.5% | ||
| Shakes and shingles and wood siding | 2.7% | 6.0% | 8.3% | 2.1% | -0.8% | ||
| Wood windows and doors | 3.9% | 1.1% | 0.0% | 0.0% | 0.0% | ||
| Glass and glass products (except automotive) | 5.0% | 5.3% | -0.2% | -0.2% | -0.2% | ||
| Ready-mix concrete | 3.7% | -3.4% | -1.5% | -2.5% | 0.2% | ||
| Clay products (brick) | 8.7% | 4.7% | 1.2% | 0.2% | 0.2% | ||
| Fabricated structural metal | 10.1% | 7.1% | 0.5% | 2.3% | -0.2% | ||
| Prefabricated metal buildings | 10.5% | 17.3% | 0.3% | 0.6% | -0.9% | ||
| Metal windows and doors | 17.4% | 11.6% | 6.2% | 6.2% | 6.2% | ||
| Metal roofing | 21.0% | 11.1% | 2.9% | -0.1% | 0.0% | ||
| Bolts, nuts, screws, washers, fasteners | 18.0% | 6.4% | 5.5% | 4.6% | 0.2% | ||
| Hardware | 4.2% | 4.6% | 0.8% | 1.0% | -0.2% | ||
| Plastic pipe fittings | 0.8% | 0.0% | 0.0% | 0.0% | 0.0% | ||
| Plastic plumbing fixtures | 8.5% | 2.5% | 2.6% | 0.3% | -0.1% | ||
| Electric lamps, lighting fixtures | 0.3% | 2.3% | 4.0% | 1.9% | 1.2% | ||
| Concrete pipes and fittings | 1.5% | -0.6% | -2.4% | 1.2% | 0.0% | ||
| Asphalt | 59.1% | 24.8% | -9.9% | -13.4% | -1.8% | ||
| Gasoline (regular) | 14.6% | -15.8% | -25.3% | -20.1% | -2.2% | ||
| Diesel fuel | 39.4% | -6.7% | -9.8% | -14.2% | -1.5% | ||
| Natural gas | 5.6% | 2.9% | 6.6% | 4.8% | 3.8% | ||
| Gypsum | 5.8% | 7.0% | -2.5% | -0.9% | -1.8% | ||
| Iron ore | 69.5% | 6.9% | 19.5% | 6.0% | 9.1% | ||
| Stone | 10.2% | 6.2% | 0.3% | 1.9% | 0.8% |
Table: ConstructConnect.
Among individual line items in Table 1, for specific construction material inputs, the biggest y/y blips have been in: waferboard and particle board, +16.3%; prefabricated metal buildings, +17.3%; metal windows and doors, +11.6%; metal roofing, +11.1%; and asphalt, +24.8%.
The most notable pull-backs in prices y/y have been in: softwood lumber, -12.2%; gasoline, -15.8%; and diesel fuel, -6.7%.
Total Construction Materials Cost Index:
The history of the total construction materials cost index for Canada has been plotted in Graph 1. Also appearing in Graph 1 are trend lines showing exponential growth rates between key data points. The trend lines appear flat, but when viewed more closely, they have curvature due to compounding of the month-to-month changes.
Most of the IPPI series have January 2010 as their start date. There is no history extending back further. For total construction, the compounding rate of increase along the entire period covered, from January 2010 to January 2019, has been +2.4%. It’s remarkable that the U.S. ‘final demand construction’ PPI has also moved upwards at a +2.4% annual compounding rate over the past nine years.
From the fall of last year to the present, Canada’s total construction materials cost index has moderated once again.
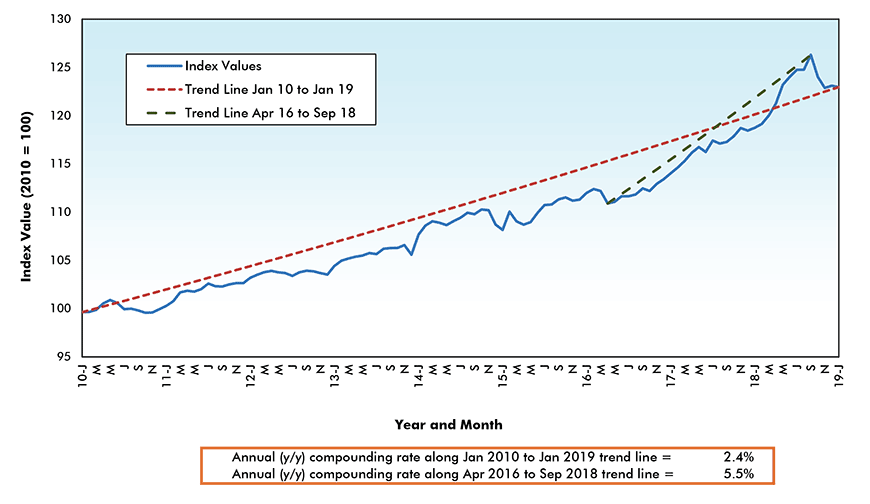
Chart: ConstructConnect.
Softwood Lumber:
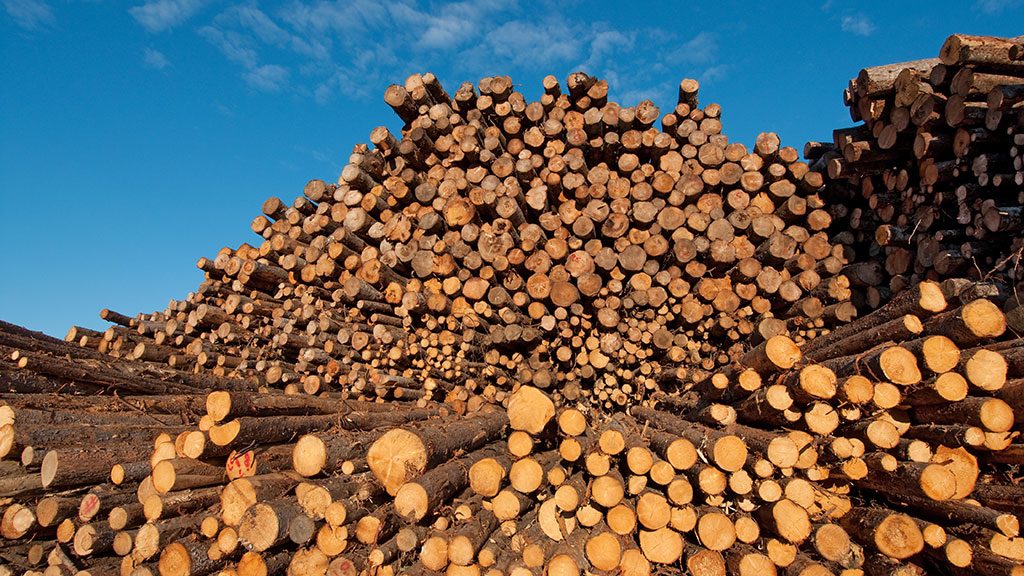
From January 2010 to January 2019, Canada’s softwood lumber IPPI has risen at a +4.8% annualized rate. The comparable figure for the U.S. with respect to its softwood lumber material inputs, over the same time frame, has been nearly identical, at +4.7%.
There are two takeaways from the similarity in the foregoing percent changes. First, that Canadian lumber prices are heavily dependent on activity levels in the U.S. new homebuilding market. U.S. housing starts remain considerably less than potential, but they are still a factor of six (1.2 million to 200,000) relative to Canadian units. Second, price changes within a country appear to follow their own internally-generated path without as dramatic course variability from currency alterations as one might suppose. (The Canadian dollar has gone through some major exchange rate adjustments during the latest decade.)
From December 2016 to June 2018, Canadian softwood lumber prices skyrocketed at a +31.4% per annum rate. The imposition of U.S. tariffs on Canadian imports accounted for about two-thirds of those increases. From mid-2018 on, however, and with both U.S. and Canadian housing starts taking a breather, softwood lumber prices have scurried into the shade.
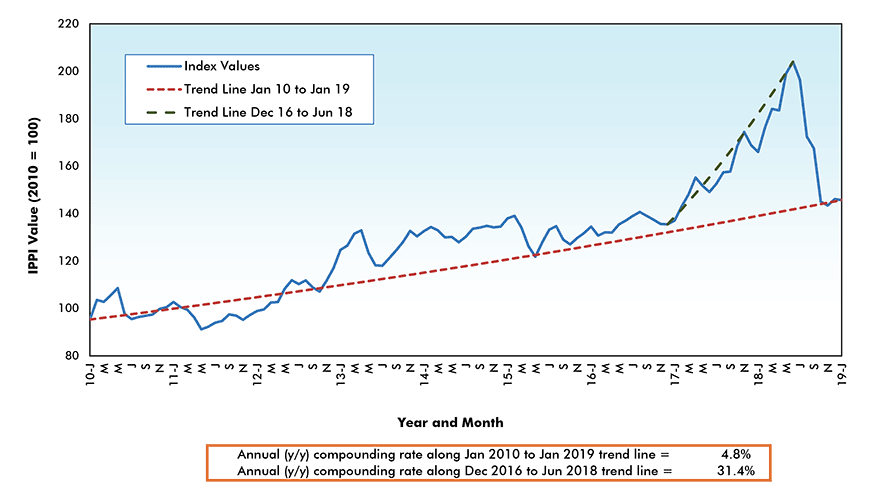
Chart: ConstructConnect.
Fabricated Steel Plate, Rebar and Joists:
The nine-year trend line, from January 2010 to January 2019, for the Canadian fabricated steel plate, rebar and joists IPPI has been ascending at a +3.4% annualized rate. There is approximate correspondence with the closely-related U.S. steel bars, plates and structural shapes PPI, which moved forward at +4.3% y/y for the same period.
From April 2013 to the present, Canada’s steel IPPI has picked up a little steam, +4.8% annualized. With the advent of U.S. tariffs on steel imports from Canada, and retaliatory measures adopted by Ottawa, the Canadian steel IPPI shot up in mid-2018, but it has since settled back down.
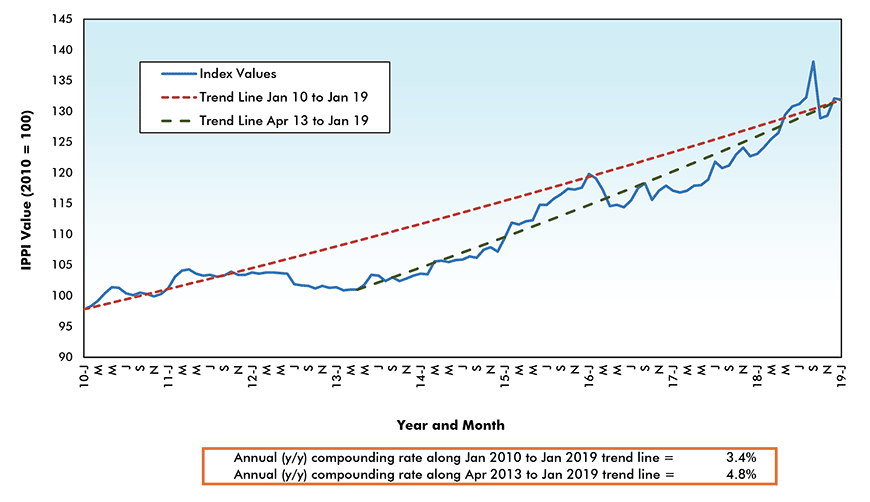
Chart: ConstructConnect.
Ready-Mix Concrete:
Between January 2010 and January of this year, the annualized rate of increase of ready-mix concrete prices in Canada has been only +1.4%. (The comparable number for the U.S. has been +3.4%). While Canada’s rate of advance has been modest, there was a period from mid-2016 to early 2018 when the slope of the curve was much steeper, representing an annualized rate of increase of +7.4%. But as happened for several other major construction materials, ready-mix concrete’s IPPI mainly retreated throughout 2018.
A crucial component of ready-mix concrete is cement and Canada has been fortunate in realizing miniscule annual advances in cement prices over the past nine years. From January 2010 to January 2019, the annualized increase in cement prices in Canada has been just +0.8%.
Furthermore, according to Statistics Canada, there have been no increases – and, indeed, some easing − since January 2017.
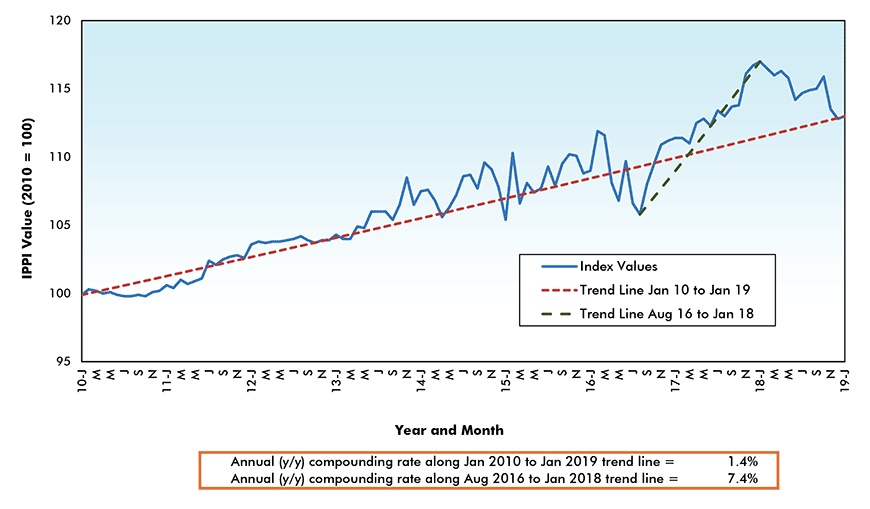
Chart: ConstructConnect.
Gypsum Building Materials:
From start-point to end-point in Graph 5, Canada’s gypsum building materials IPPI has been escalating at a +4.2% annualized rate. But there have been three separate and distinct periods within the past nine years. January 2010 to mid-2012 was an almost-flat to slightly-declining phase. It was followed by livelier movement, +4.2% annualized, from mid-2012 to the beginning of 2016. Then, the steepness of the slope angled sharply higher, at an annual rate of +10.8%, from January 2016 until now.
The price question in Canada has been complicated by inquiries into the possible dumping of gypsum board into the Western provinces by U.S. manufacturers. Temporary large counter-vailing duties were first imposed during home, office, school and store rebuilding efforts after a wildfire devastated Fort McMurry, Alberta, in May 2016. Those measures were later modified, but a close watch is now being kept on larger-dimension drywall.
Since September 2011, gypsum board prices in the U.S. have been rising at a +7.3% annualized rate. In Canada, again since September 2011, the cost of ‘raw’ gypsum from quarries, as appearing among the RMPI series, has been climbing at a +11.5% per annum rate.
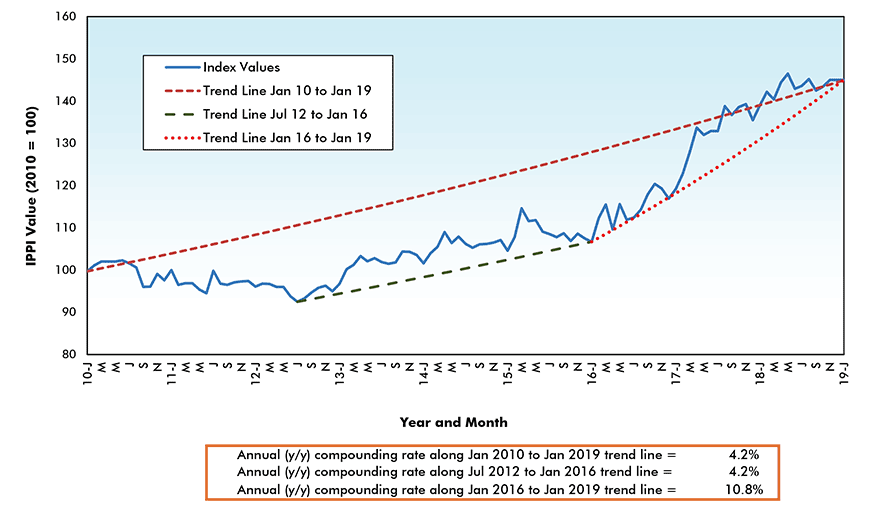
Chart: ConstructConnect.
Flat Glass:
There’s been a step pattern to flat glass prices in Canada. The long-term rate of increase, as recorded in Graph 6, has been +2.9% y/y. But there have been periods when prices stabilized and even retreated. For example, between August 2015 and May 2018, Canada’s Glass IPPI contracted -0.4% at an annualized rate.
In the U.S., the y/y increase in flat glass prices from 2010 to the present has been in close alignment with Canada’s experience, +2.7%. Efforts to establish new glass-making capacity are sometimes being opposed by residents of potentially-affected communities who form action committees to put voice to their concerns about the large amounts of water used in the production and cooling process.
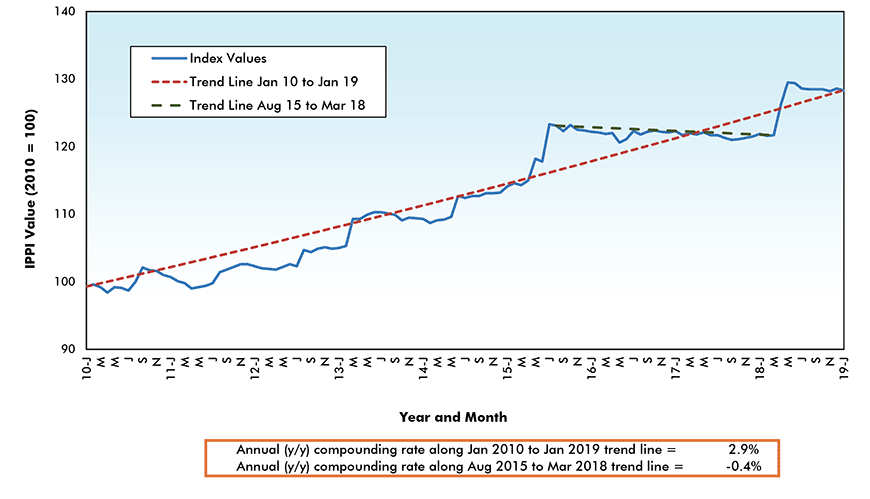
Chart: ConstructConnect.
Aluminum Shapes:
In Canada, the price of aluminum shapes has been increasing at a +2.6% annualized rate since January 2010. In the U.S., the comparable percentage change over the same stretch of time has been +3.3%.
Over a shorter period, however, the rates of gain have been considerably speedier: +9.0% annualized in Canada from May 2016 to the present and +7.6% annualized in the U.S. from February 2016 until January of this current year.
Note that the beginning points of those shorter periods in Canada and the U.S. were in the first half of 2016. Therefore, it’s clear that in both countries, aluminum prices were moving assertively higher well ahead of the imposition of tariffs last year.
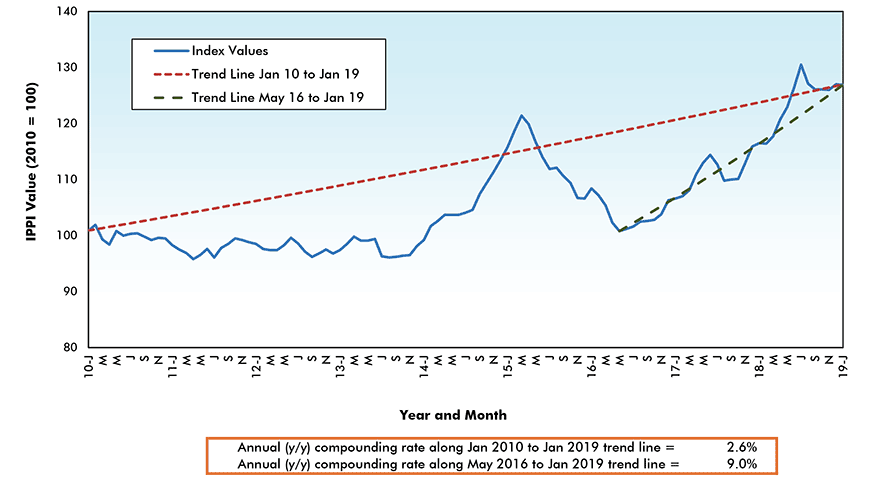
Chart: ConstructConnect.
Explanation of a Cost or Price Index:
A price index takes a dollar cost in a specified starting period, or what is termed a ‘base’ period, and assigns it the value of 100.0. Each subsequent monthly dollar value is calculated as a ratio of the ‘base’ value, but it is expressed relative to 100.0. For example, if the price doubles in two years versus its base, the index figure after two years will be 200.0. The advantage of adopting an index methodology is that numerous diverse items can all be assigned the same starting value to determine how they perform relative to each other over time.






Recent Comments
comments for this post are closed