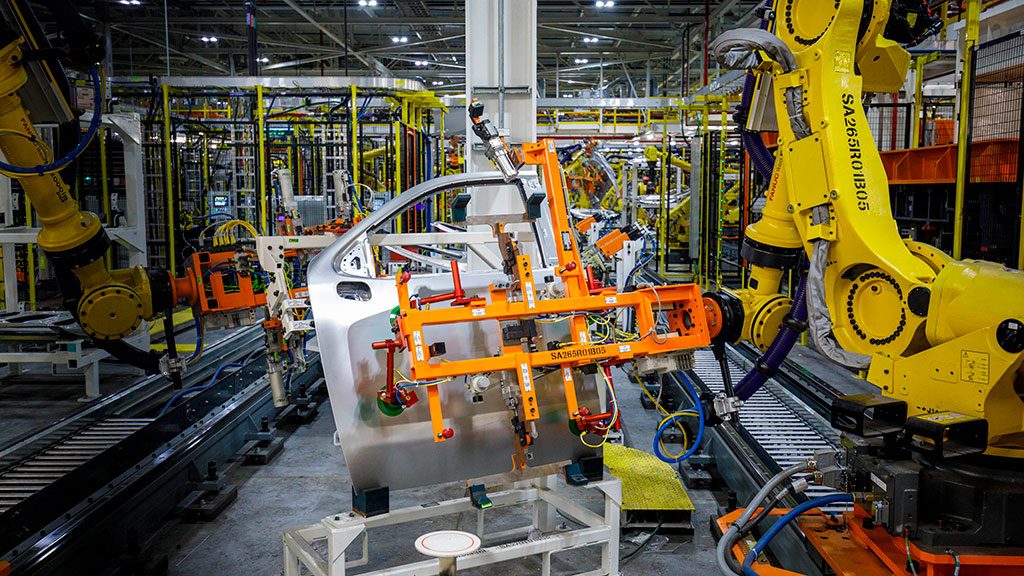
Construction spending in various type-of structure categories is driven by economic circumstances within specific industrial sub-sectors. For example, manufacturers set the pace in industrial construction.

Good health in the leisure and hospitality sector provides the backing for new hotel and motel work. And jobs levels in information and financial services, as well as in more rapidly expanding fields of endeavor such as computer systems and design services, establish the need for additional office space and commercial tower square footage. (See, “Shifts in Office Jobs and Implications for Commercial Tower Construction“.)
This article is the first in a series of seven that examines key industrial sectors to determine where they are most prominent regionally. Rankings of state strength in each industrial sub-sector are based on both ‘weight’ and ‘concentration’ of relevant employment. ‘Weight’ is simply the number of jobs in the industrial sub-sector in each state. ‘Concentration’ is each state’s number of jobs in the sub-sector divided by the state’s population. In effect, it’s a ‘per capita’ figure, except that it’s expressed as number of jobs per million population.
By ‘weight’, the states with the largest populations are almost always high in the rankings. The rankings by ‘concentration’, however, often deliver a jolt of surprise or two.
State Tiers:
It’s important to know that three clear groupings of states emerge from an analysis of the Census Bureau’s latest (i.e., through July 1, 2018) population statistics. Those groupings are: (A) the four frontrunner states by nominal levels of population – California, Texas, Florida and New York; (B) the three states with the fastest year-over-year gains in population – Nevada, Idaho and Utah; and (C) another tier of six states with both strong nominal increases and percentage changes in resident counts over the past several years – Washington, North Carolina, Georgia, Arizona, Colorado and South Carolina. (See, ““Latest State Population Statistics, Maps, & Tables – Six Dark Horse Winners“.)
Also read, “Series (2 of 7): Rankings of States by Industrial Subsector Jobs – Financial Services“; “Series (3 of 7): Rankings of States by Industrial Subsector Jobs – Information Services“; “Series (4 of 7): Rankings of States by Industrial Subsector Jobs – Leisure and Hospitality“; and “Series (5 of 7): Rankings of States by Industrial Subsector Jobs – Computer Systems Design and Related Services“.
State Leaders in Manufacturing Jobs – Highlights:
(1) The four most populous states all appear among the Top Dozen for nominal levels of manufacturing jobs. But also notice that seven states, mainly in the Midwest, lie between Texas and New York in the ‘weight’ ranking. Ohio, Michigan, Illinois, Pennsylvania, Indiana and Wisconsin have long been stalwarts of American industry.
(2) Among the Midwest heavy hitters in manufacturing, the state which ranks number one for ‘concentration’ of jobs in the sector is Wisconsin (paper and processed dairy products). Indiana (transportation equipment) comes next.
(3) The five major contributors to U.S. manufacturing employment are: transportation equipment, a 13.2% share; food manufacturing, 12.9%; fabricated metal products, 11.7%; machinery, 8.9%; and computer and electronic products, 8.4%.
(4) Michigan (with an 11.4% share) leads all states in number of transportation equipment jobs. It’s followed by Indiana (8.2%). California and Ohio (each with 7.3% shares) are tied for third.
(5) By a wide margin, California is out front among states in number of food manufacturing jobs.
(6) California and Texas provide the most ‘fabricated metal product’ jobs; Ohio is in third spot.
(7) Texas, which is big in oil and gas drilling equipment, is the nation’s leader in machinery manufacturing jobs.
(8) More than a quarter of U.S. ‘computer and electronic products’ manufacturing jobs are in California. Second-place Texas has only about one-third of California’s contingent.
Map 1: Top 12 – Rankings of States by Industrial Sub-Sector Jobs – “Weight”
Share of Total U.S. Manufacturing Jobs
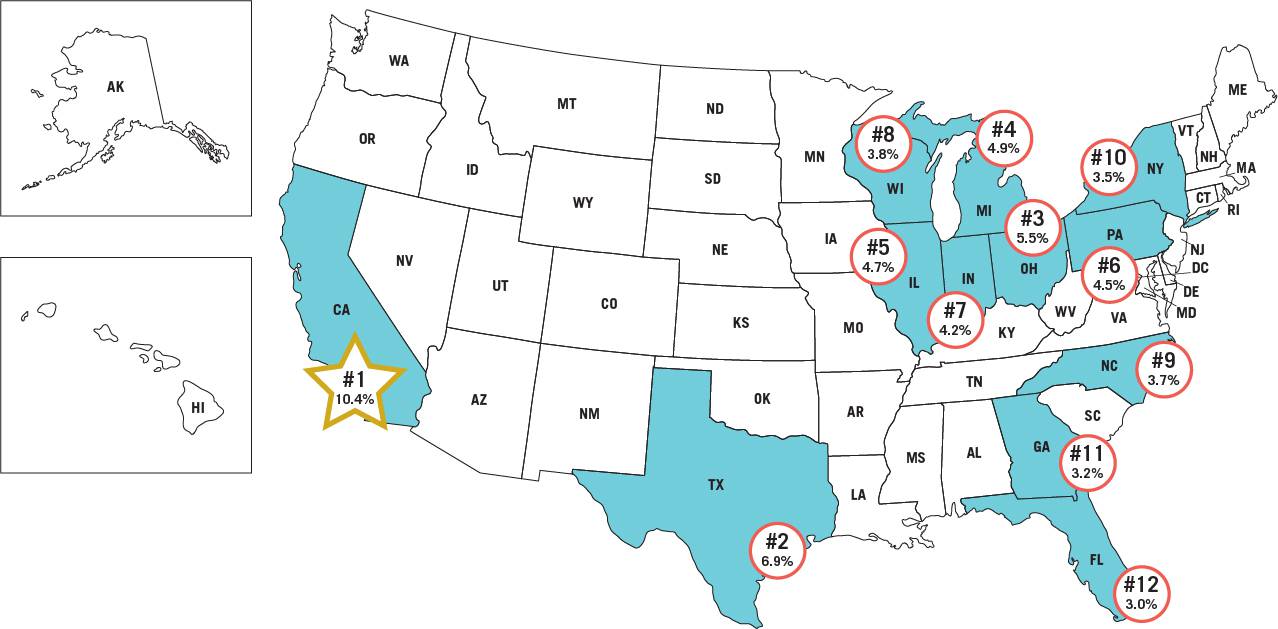
Data source: Bureau of Labor Statistics (BLS).
Graphic: ConstructConnect.
Map 2: Top 12 – Rankings of States by Industrial Sub-Sector Jobs – “Concentration”
Manufacturing Jobs Per Million Residents of the State
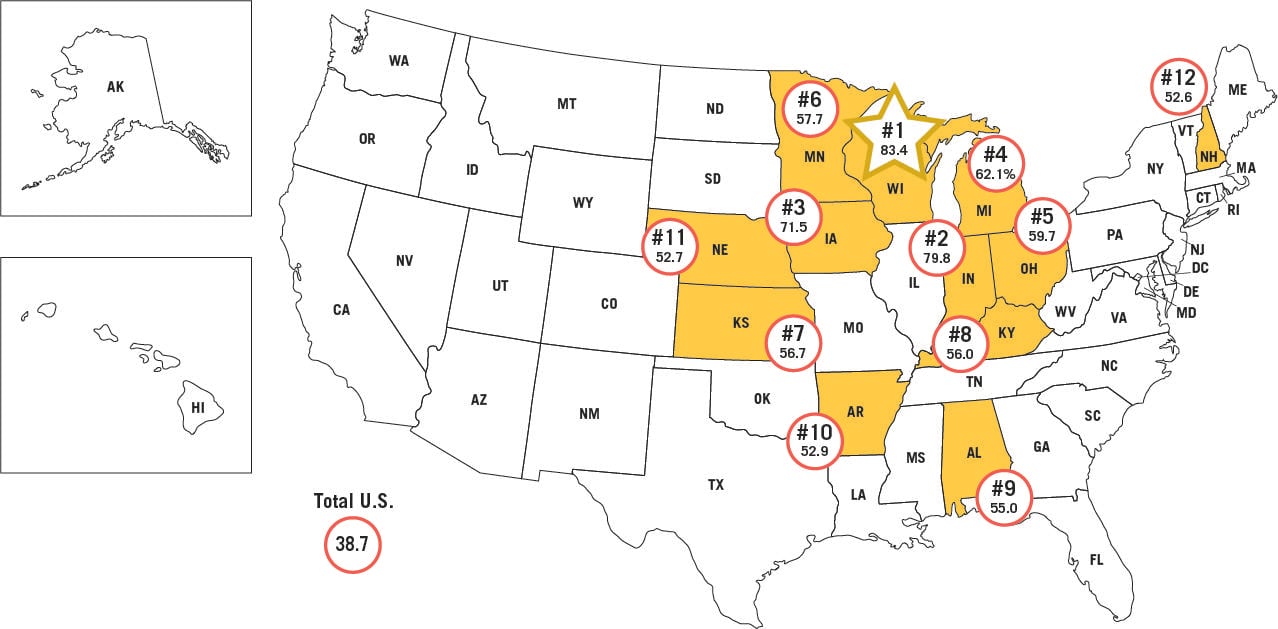
Total U.S. number of manufacturing jobs per million population is 38.7.
Data source: Bureau of Labor Statistics (BLS).
Graphic: ConstructConnect.
Tables: Ranking of States by Manufacturing Jobs
| Table 1: Weight: | Table 2: Concentration: | ||||||
| Share of Total U.S. | Manufacturing Jobs | ||||||
| Manufacturing Jobs | Per Million Residents of the State | ||||||
| 1 | California | 10.4% | 1 | Wisconsin | 83.4 | ||
| 2 | Texas | 6.9% | 2 | Indiana | 79.8 | ||
| 3 | Ohio | 5.5% | 3 | Iowa | 71.5 | ||
| 4 | Michigan | 4.9% | 4 | Michigan | 62.1 | ||
| 5 | Illinois | 4.7% | 5 | Ohio | 59.7 | ||
| 6 | Pennsylvania | 4.5% | 6 | Minnesota | 57.7 | ||
| 7 | Indiana | 4.2% | 7 | Kansas | 56.7 | ||
| 8 | Wisconsin | 3.8% | 8 | Kentucky | 56.0 | ||
| 9 | North Carolina | 3.7% | 9 | Alabama | 55.0 | ||
| 10 | New York | 3.5% | 10 | Arkansas | 52.9 | ||
| 11 | Georgia | 3.2% | 11 | Nebraska | 52.7 | ||
| 12 | Florida | 3.0% | 12 | New Hampshire | 52.6 | ||
Data source: Bureau of Labor Statistics (BLS).
Tables: ConstructConnect.


Recent Comments
comments for this post are closed