
Construction spending in various type-of structure categories is driven by economic circumstances within specific industrial sub-sectors. For example, manufacturers set the pace in industrial construction.

Good health in the leisure and hospitality sector provides the backing for new hotel and motel work. And jobs levels in information and financial services, as well as in more rapidly expanding fields of endeavor such as computer systems and design services, establish the need for additional office space and commercial tower square footage. (See, "Shifts in Office Jobs and Implications for Commercial Tower Construction".)
This article is the fourth in a series of seven that examines key industrial sectors to determine where they are most prominent regionally. Rankings of state strength in each industrial sub-sector are based on both ‘weight’ and ‘concentration’ of relevant employment. ‘Weight’ is simply the number of jobs in the industrial sub-sector in each state. ‘Concentration’ is each state’s number of jobs in the sub-sector divided by the state’s population. In effect, it’s a ‘per capita’ figure, except that it’s expressed as number of jobs per million population.
By ‘weight’, the states with the largest populations are almost always high in the rankings. The rankings by ‘concentration’, however, often deliver a jolt of surprise or two.
State Tiers:
It’s important to know that three clear groupings of states emerge from an analysis of the Census Bureau’s latest (i.e., through July 1, 2018) population statistics. Those groupings are: (A) the four frontrunner states by nominal levels of population – California, Texas, Florida and New York; (B) the three states with the fastest year-over-year gains in population – Nevada, Idaho and Utah; and (C) another tier of six states with both strong nominal increases and percentage changes in resident counts over the past several years – Washington, North Carolina, Georgia, Arizona, Colorado and South Carolina. (See, "“Latest State Population Statistics, Maps, & Tables – Six Dark Horse Winners".)
Also read, “Series (1 of 7): Rankings of States by Industrial Subsector Jobs – Manufacturing“; “Series (2 of 7): Rankings of States by Industrial Subsector Jobs – Financial Services“; “Series (3 of 7): Rankings of States by Industrial Subsector Jobs – Information Services“; and “Series (5 of 7): Rankings of States by Industrial Subsector Jobs – Computer Systems Design and Related Services“.
State Leaders in Leisure and Hospitality Jobs – Highlights:
(1) The four largest-population states are also ranked numbers one through four for ‘weight’, or nominal level, of ‘leisure and hospitality’ jobs. Furthermore, the ordering is the same as for population. California (population 39.6 million) is number one for ‘weight’ and is followed by Texas (population 28.7 million), Florida (population 21.3 million) and New York (population 19.5 million).
(2) Two Tier C states, North Carolina and Georgia, occupy positions eight and nine in the ‘weight’ ranking.
(3) Two Tier B states (i.e., ones with rapid percentage changes in population) rank highly for ‘concentration’. Nevada, with Las Vegas in its pocket, tops the chart and Colorado is in sixth position. Nevada may no longer have a stranglehold on gambling in the country, with casinos springing up seemingly everywhere, but it is still the go-to place for an unlimited variety of excitement.
(3) The top three states according to ‘concentration’ (jobs per million of the state’s citizens) are among the world’s best-known tourism meccas − Nevada, Washington D.C. and Hawaii. Plus, sunny Florida, with its amusement theme parks in Orlando and cruise ship terminals in Miami and Fort Lauderdale, is in eighth spot.
(4) Positions four through seven for ‘concentration’ are held by four states with winter attractions, specifically skiing. They are Wyoming (Jackson Hole); Montana (Whitefish Mountain); Colorado (Vail and Aspen); and Vermont (Stowe, Killington and Sugarbush).
(5) Ranked number 12 for ‘concentration’ is South Dakota, famous for Mount Rushmore located in the Black Hills region of the southwest corner of the state.
(6) Nation-wide, there are more jobs per million people engaged in ‘leisure and hospitality’ activities (49.9) than in ‘total manufacturing’ (38.7) and ‘construction’ (21.9).
Map 1: Top 12 – Rankings of States by Industrial Sub-sector Jobs – “Weight”
Share of Total U.S. Leisure and Hospitality Jobs
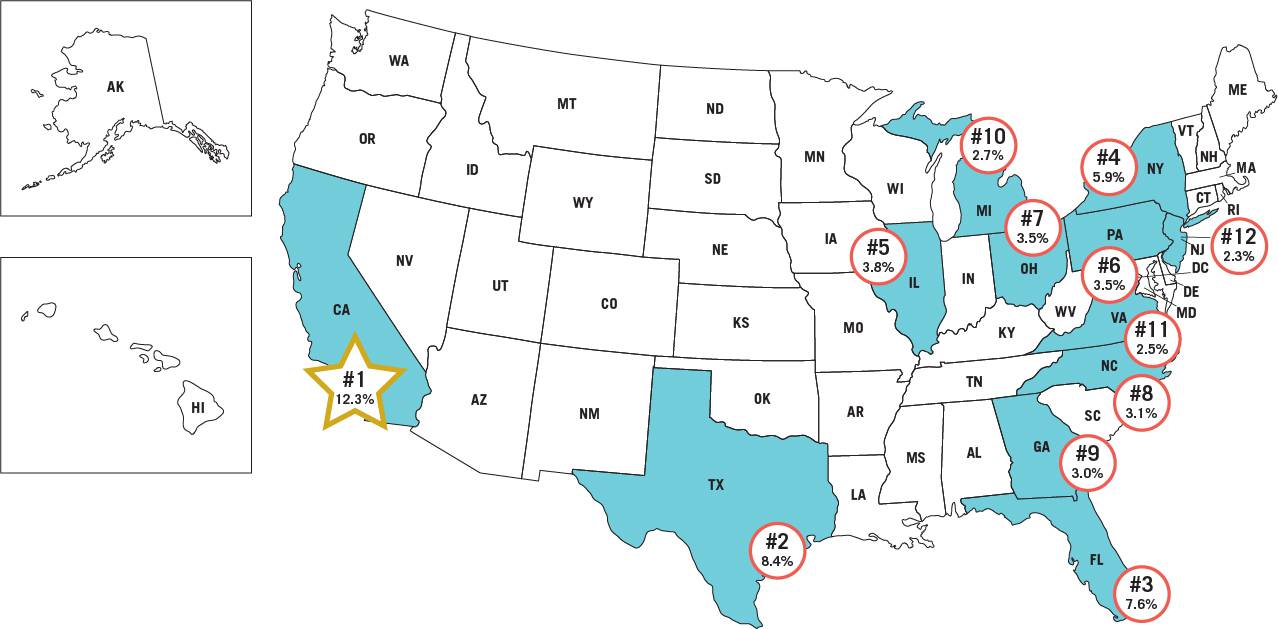
Data source: Bureau of Labor Statistics (BLS).
Graphic: ConstructConnect.
Map 2: Top 12 – Rankings of States by Industrial Sub-sector Jobs – “Concentration”
Leisure and Hospitality Jobs Per Million Residents of the State
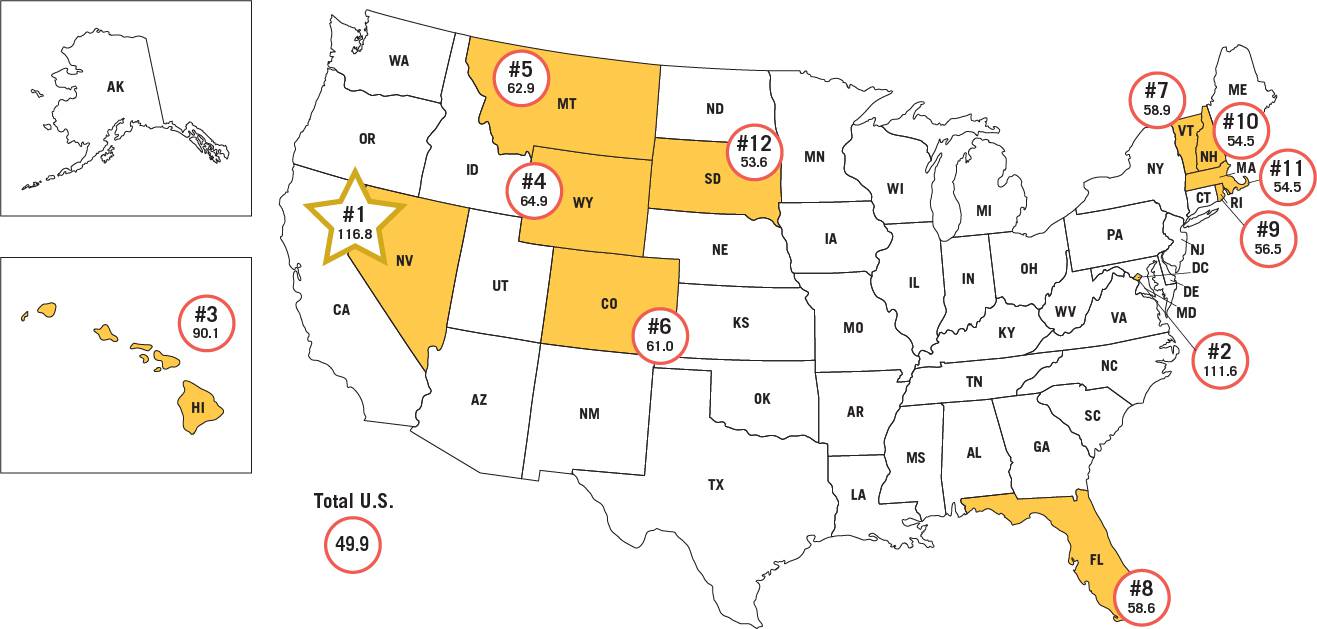
Total U.S. number of leisure and hospitality jobs per million population is 49.9.
Data source: Bureau of Labor Statistics (BLS).
Graphic: ConstructConnect.
Tables: Ranking of States by Leisure and Hospitality Jobs
| Table 1: Weight: | Table 2: Concentration: | ||||||
| Share of Total U.S. | leisure and hospitality Jobs | ||||||
| Leisure and hospitality Jobs | Per Million Residents of the State | ||||||
| 1 | California | 12.3% | 1 | Nevada | 116.8 | ||
| 2 | Texas | 8.4% | 2 | District of Columbia | 111.6 | ||
| 3 | Florida | 7.6% | 3 | Hawaii | 90.1 | ||
| 4 | New York | 5.9% | 4 | Wyoming | 64.9 | ||
| 5 | Illinois | 3.8% | 5 | Montana | 62.9 | ||
| 6 | Pennsylvania | 3.5% | 6 | Colorado | 61.0 | ||
| 7 | Ohio | 3.5% | 7 | Vermont | 58.9 | ||
| 8 | North Carolina | 3.1% | 8 | Florida | 58.6 | ||
| 9 | Georgia | 3.0% | 9 | Rhode Island | 56.5 | ||
| 10 | Michigan | 2.7% | 10 | New Hampshire | 54.5 | ||
| 11 | Virginia | 2.5% | 11 | Massachusetts | 54.5 | ||
| 12 | New Jersey | 2.3% | 12 | South Dakota | 53.6 | ||
Total U.S. number of leisure and hospitality jobs per million population is 49.9.
Data source: Bureau of Labor Statistics (BLS).
Tables: ConstructConnect.


Recent Comments
comments for this post are closed