
Construction spending in various type-of structure categories is driven by economic circumstances within specific industrial sub-sectors. For example, manufacturers set the pace in industrial construction.

Good health in the leisure and hospitality sector provides the backing for new hotel and motel work. And jobs levels in information and financial services, as well as in more rapidly expanding fields of endeavor such as computer systems and design services, establish the need for additional office space and commercial tower square footage. (See, "Shifts in Office Jobs and Implications for Commercial Tower Construction".)
This article is the third in a series of seven that examines key industrial sectors to determine where they are most prominent regionally. Rankings of state strength in each industrial sub-sector are based on both ‘weight’ and ‘concentration’ of relevant employment. ‘Weight’ is simply the number of jobs in the industrial sub-sector in each state. ‘Concentration’ is each state’s number of jobs in the sub-sector divided by the state’s population. In effect, it’s a ‘per capita’ figure, except that it’s expressed as number of jobs per million population.
By ‘weight’, the states with the largest populations are almost always high in the rankings. The rankings by ‘concentration’, however, often deliver a jolt of surprise or two.
State Tiers:
It’s important to know that three clear groupings of states emerge from an analysis of the Census Bureau’s latest (i.e., through July 1, 2018) population statistics. Those groupings are: (A) the four frontrunner states by nominal levels of population – California, Texas, Florida and New York; (B) the three states with the fastest year-over-year gains in population – Nevada, Idaho and Utah; and (C) another tier of six states with both strong nominal increases and percentage changes in resident counts over the past several years – Washington, North Carolina, Georgia, Arizona, Colorado and South Carolina. (See, "Latest State Population Statistics, Maps, & Tables – Six Dark Horse Winners".)
Also read, “Series (1 of 7): Rankings of States by Industrial Subsector Jobs – Manufacturing“; “Series (2 of 7): Rankings of States by Industrial Subsector Jobs – Financial Services“; “Series (4 of 7): Rankings of States by Industrial Subsector Jobs – Leisure and Hospitality“; and “Series (5 of 7): Rankings of States by Industrial Subsector Jobs – Computer Systems Design and Related Services“.
State Leaders in Information Services Jobs – Highlights:
(1) The ‘information services’ sector includes broadcasting (radio, TV and cable), conventional publishing (newspapers and books), Internet publishing, software publishing, telecommunications, data processing and motion picture and sound recording.
(2) The four Tier A largest-population states dominate the ‘weight’, or nominal-number-of-jobs, ranking. California, New York, Texas and Florida, which together account for one-third of the country’s population, play an even bigger role in America’s total ‘information services’ jobs market. Their combined share is slightly more than 40% (i.e., two out of every five such jobs).
(3) The Top Dozen ‘weight’ ranking includes four of the six Tier C states – Washington, Georgia, North Carolina and Colorado. Furthermore, three Tier C states are among the best for ‘concentration’ of information services jobs – Washington, Colorado and Georgia. This isn’t a coincidence. Tier C features a grouping of states with solid levels of population and rapidly growing citizen counts. In turn, strong demographic numbers correlate with abundant and high-paying jobs. Many information services activities require high-tech expertise. (Notice, also, that a Tier B state, Utah, lays claim to seventh spot in the Top Dozen ‘concentration’ ranking.)
(4) Thanks to a major-league presence of ‘motion picture and sound recording’ studios, nearly one in five total U.S. ‘information services’ jobs is located in California.
(5) First-place-ranked District of Columbia has an extremely high ‘concentration’ (i.e., employment in the sub-sector per million population) of information services jobs. As the epicenter of political power in the country, D.C. is home to a prodigious and vigorous media presence.
(6) Washington State’s second-place ‘concentration’ ranking derives largely from software development.
(7) California generates about one-fifth of all U.S. software publishing jobs; Washington contributes one-sixth. Combining those two shares yields a slice of software publishing jobs, based in either California or Washington, that is greater than one-third of the U.S. total.
(8) Massachusetts also figures prominently in software publishing, providing a share of America’s total that is just under 10%.
Map 1: Top 12 – Rankings of States by Industrial Sub-Sector Jobs – “Weight”
Share of Total U.S. Information Services Jobs
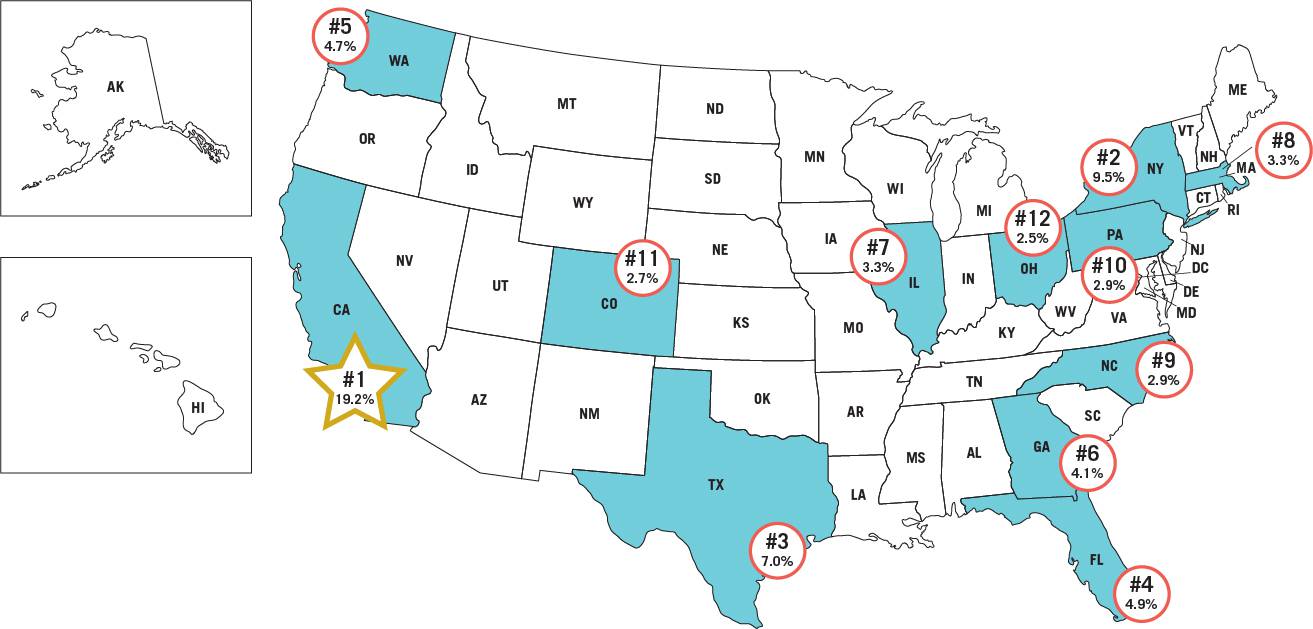
Data source: Bureau of Labor Statistics (BLS).
Graphic: ConstructConnect.
Map 2: Top 12 – Rankings of States by Industrial Sub-Sector Jobs – “Concentration”
Information Services Jobs Per Million Residents of the State
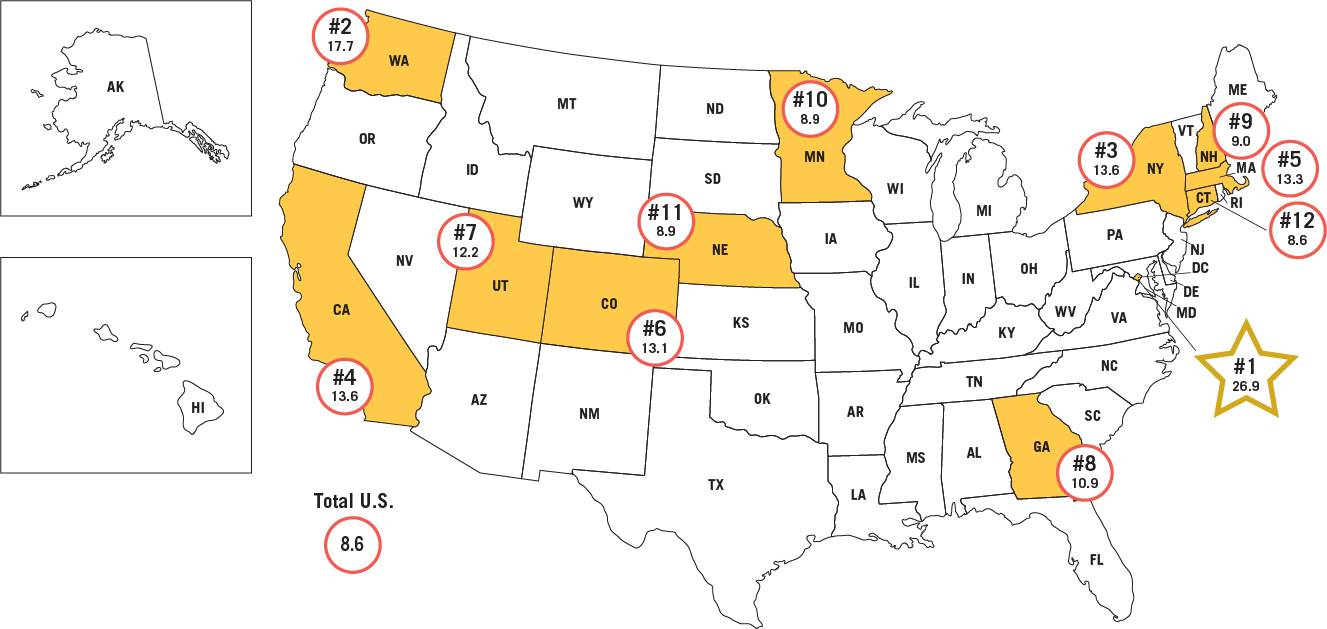
Total U.S. number of information services jobs per million population is 8.6.
Data source: Bureau of Labor Statistics (BLS).
Graphic: ConstructConnect.
Tables: Ranking of States by Information Services Jobs
| Table 1: Weight: | Table 2: Concentration: | ||||||
| Share of Total U.S. | INFORMATION SERVICES Jobs | ||||||
| INFORMATION SERVICES Jobs | Per Million Residents of the State | ||||||
| 1 | California | 19.2% | 1 | District of Columbia | 26.9 | ||
| 2 | New York | 9.5% | 2 | Washington | 17.7 | ||
| 3 | Texas | 7.0% | 3 | New York | 13.6 | ||
| 4 | Florida | 4.9% | 4 | California | 13.6 | ||
| 5 | Washington | 4.7% | 5 | Massachusetts | 13.3 | ||
| 6 | Georgia | 4.1% | 6 | Colorado | 13.1 | ||
| 7 | Illinois | 3.3% | 7 | Utah | 12.2 | ||
| 8 | Massachusetts | 3.3% | 8 | Georgia | 10.9 | ||
| 9 | North Carolina | 2.9% | 9 | New Hampshire | 9.0 | ||
| 10 | Pennsylvania | 2.9% | 10 | Minnesota | 8.9 | ||
| 11 | Colorado | 2.7% | 11 | Nebraska | 8.9 | ||
| 12 | Ohio | 2.5% | 12 | Connecticut | 8.6 | ||
Total U.S. number of information services jobs per million population is 8.6.
Data source: Bureau of Labor Statistics (BLS).
Tables: ConstructConnect.


Recent Comments
comments for this post are closed