
Construction spending in various type-of structure categories is driven by economic circumstances within specific industrial sub-sectors. For example, manufacturers set the pace in industrial construction.

Good health in the leisure and hospitality sector provides the backing for new hotel and motel work. And jobs levels in information and financial services, as well as in more rapidly expanding fields of endeavor such as computer systems and design services, establish the need for additional office space and commercial tower square footage. (See, "Shifts in Office Jobs and Implications for Commercial Tower Construction".)
This article is the second in a series of seven that examines key industrial sectors to determine where they are most prominent regionally. Rankings of state strength in each industrial sub-sector are based on both ‘weight’ and ‘concentration’ of relevant employment. ‘Weight’ is simply the number of jobs in the industrial sub-sector in each state. ‘Concentration’ is each state’s number of jobs in the sub-sector divided by the state’s population. In effect, it’s a ‘per capita’ figure, except that it’s expressed as number of jobs per million population.
By ‘weight’, the states with the largest populations are almost always high in the rankings. The rankings by ‘concentration’, however, often deliver a jolt of surprise or two.
State Tiers:
It’s important to know that three clear groupings of states emerge from an analysis of the Census Bureau’s latest (i.e., through July 1, 2018) population statistics. Those groupings are: (A) the four frontrunner states by nominal levels of population – California, Texas, Florida and New York; (B) the three states with the fastest year-over-year gains in population – Nevada, Idaho and Utah; and (C) another tier of six states with both strong nominal increases and percentage changes in resident counts over the past several years – Washington, North Carolina, Georgia, Arizona, Colorado and South Carolina. (See, "“Latest State Population Statistics, Maps, & Tables – Six Dark Horse Winners".)
Also read, “Series (1 of 7): Rankings of States by Industrial Subsector Jobs – Manufacturing“; “Series (3 of 7): Rankings of States by Industrial Subsector Jobs – Information Services“; “Series (4 of 7): Rankings of States by Industrial Subsector Jobs – Leisure and Hospitality“; and “Series (5 of 7): Rankings of States by Industrial Subsector Jobs – Computer Systems Design and Related Services“.
State Leaders in Financial Services Jobs – Highlights:
(1) The tier (A) biggest-population states occupy positions one through four in the table showing ‘weightings’ of financial services jobs. New York City is one of the world’s premier financial capitals and, therefore, it’s a bit of a surprise that N.Y. state appears below California and Texas. But be aware that the Bureau of Labor Statistics (BLS)’s definition of financial services includes much more than investment houses and stock brokerages. The sector also encompasses commodities trading (Illinois), commercial banking, insurance companies and real estate firms.
(2) A couple of tier (C) states, Georgia and North Carolina (e.g., Bank of America and Wells Fargo in Charlotte), make respectable appearances (positions 9 and 10 respectively) in the left-hand ranking-by-weight (or nominal-level-of-jobs) table.
(3) With respect to ‘concentration’ of financial services jobs (i.e., per million of population), New York is the only one of the tier (A) states making it into the Top Dozen.
(4) The state with the highest ‘concentration’ of financial services jobs is Delaware. Delaware is a ‘sleeper’ success in the sector. It has an extraordinarily high number of finance-related jobs relative to its population. More than half of publicly-traded companies in the U.S. and more than 60% of Fortune 500 companies are incorporated in Delaware, to benefit from a more-relaxed and business-friendly regulatory environment.
(5) Nebraska, also with a high ranking for ‘concentration’, is known for insurance (Mutual of Omaha) and Warren Buffet’s Berkshire Hathaway conglomerate.
Map 1: Top 12 – Rankings of States by Industrial Sub-Sector Jobs – “Weight”
Share of Total U.S. Financial Services Jobs

Data source: Bureau of Labor Statistics (BLS).
Graphic: ConstructConnect.
Map 2: Top 12 – Rankings of States by Industrial Sub-Sector Jobs – “Concentration”
Financial Services Jobs Per Million Residents of the State
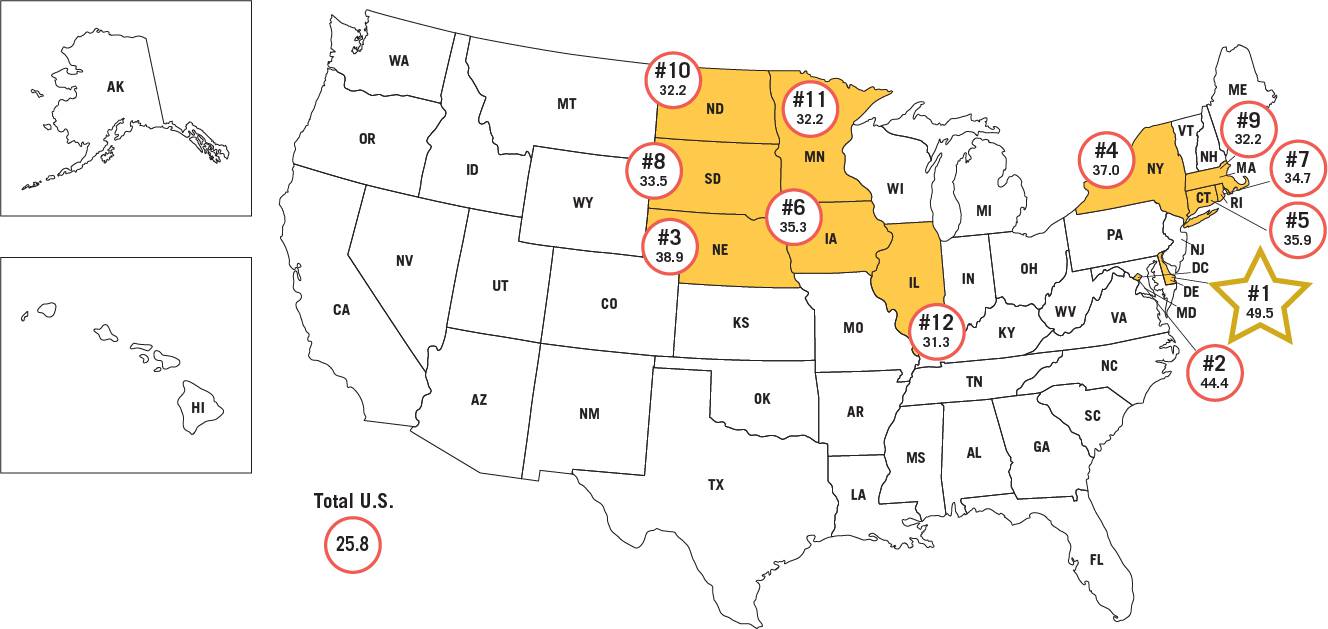
Total U.S. number of financial services jobs per million population is 25.8.
Data source: Bureau of Labor Statistics (BLS).
Graphic: ConstructConnect.
Tables: Ranking of States by Financial Services Jobs
| Table 1: Weight: | Table 2: Concentration: | ||||||
| Share of Total U.S. | FINANCIAL SERVICES Jobs | ||||||
| FINANCIAL SERVICES Jobs | Per Million Residents of the State | ||||||
| 1 | California | 9.9% | 1 | Delaware | 49.5 | ||
| 2 | Texas | 9.2% | 2 | District of Columbia | 44.4 | ||
| 3 | New York | 8.5% | 3 | Nebraska | 38.9 | ||
| 4 | Florida | 6.8% | 4 | New York | 37.0 | ||
| 5 | Illinois | 4.7% | 5 | Connecticut | 35.9 | ||
| 6 | Pennsylvania | 3.8% | 6 | Iowa | 35.3 | ||
| 7 | Ohio | 3.7% | 7 | Rhode Island | 34.7 | ||
| 8 | New Jersey | 2.9% | 8 | South Dakota | 33.5 | ||
| 9 | Georgia | 2.9% | 9 | Massachusetts | 32.2 | ||
| 10 | North Carolina | 2.8% | 10 | North Dakota | 32.2 | ||
| 11 | Massachusetts | 2.6% | 11 | Minnesota | 32.2 | ||
| 12 | Michigan | 2.6% | 12 | Illinois | 31.3 | ||
Total U.S. number of financial services jobs per million population is 25.8.
Data source: Bureau of Labor Statistics (BLS).
Tables: ConstructConnect.


Recent Comments
comments for this post are closed